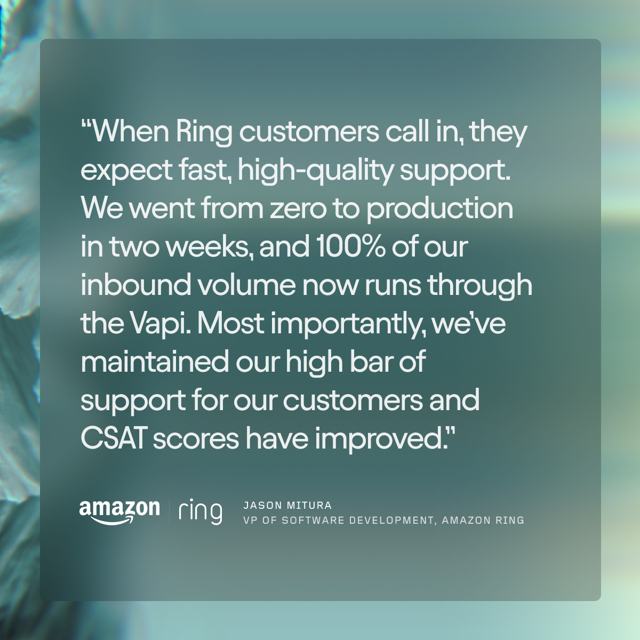
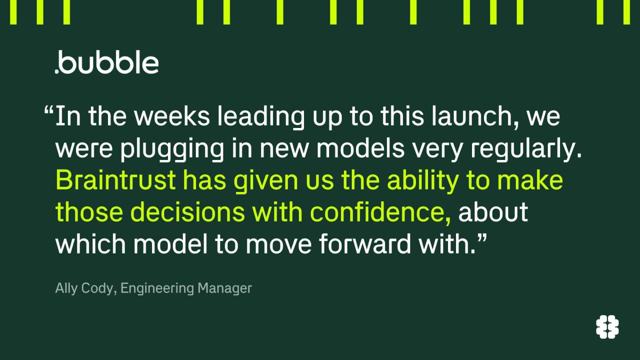
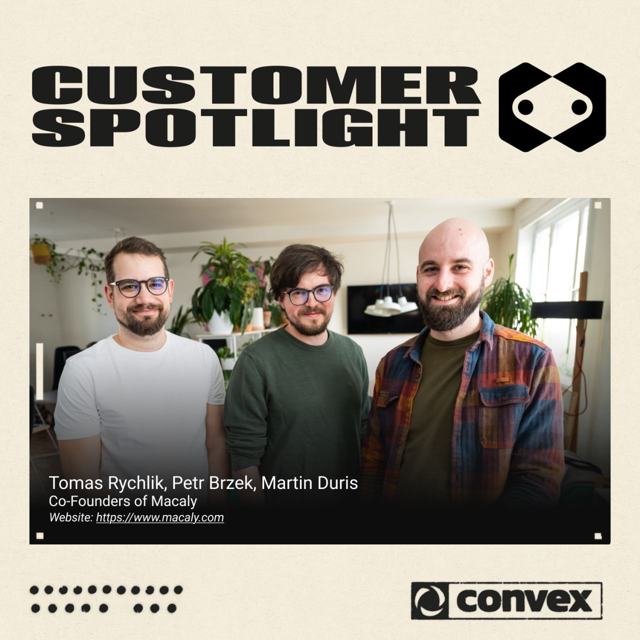
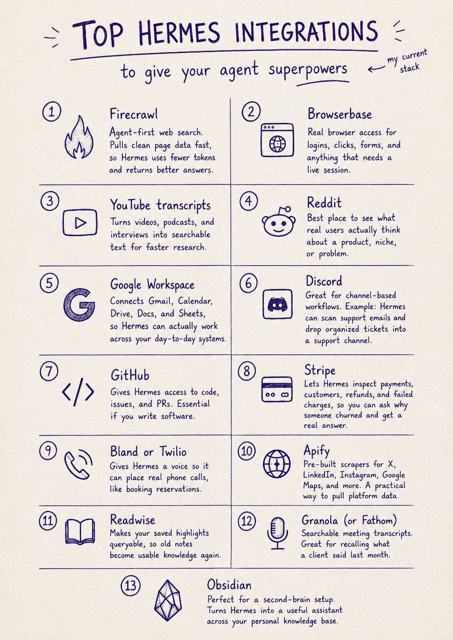
The complete content mix, the relative performance of each type and format, and compact examples of posts that did better or worse.
22 companies3,939 eligible posts2 platforms
Every post is included in the content inventory. Performance comparisons use each company as its own baseline, control for publication month, and show uncertainty. Likes, comments and shares measure public response; X views are reported separately. Read the method ↗
Composio connects AI assistants and agents to business apps such as email, calendars, and CRMs. It handles authentication and tool access so developers can make agents take useful actions across those apps. Company site ↗
Who it sells to: AI developers and teams building business automations.
All 70 posts are counted below. Top 10 and bottom 10 use equal group sizes and rank public responses relative to this company’s month. The adjusted estimate uses all comparable posts, not only these extremes.
WHAT THE POST SAYS
Content types
This account uses events and community in 26% of its LinkedIn posts. The highest category estimate is product benefits and capabilities (2.1×); the lowest is people, careers, and company culture (0.7×). These are directional estimates; the intervals below show how uncertain their size is. The table covers the whole content mix, including sparse categories.
Not enough comparable postsFewer than 5 posts on either side in overlapping months, or no usable variation.
HOW IT IS PRESENTED
Creative formats
This account uses expert or founder interview in 26% of its LinkedIn posts. The highest category estimate is presenter explanation (2.9×); the lowest is announcement card (0.7×). These are directional estimates; the intervals below show how uncertain their size is. The table covers the whole content mix, including sparse categories.
Media across all 70 posts
Video · 49 (70%)Still image · 17 (24%)Text / link · 4 (6%)
Not enough comparable postsFewer than 5 posts on either side in overlapping months, or no usable variation.
1× means similar response to this company’s other content on this platform, after accounting for month. The interval shows uncertainty; a result spanning 1× does not establish an advantage. Types and formats are analyzed separately, so this is association rather than an isolated causal effect.
Ranked by likes, comments and shares relative to the same company’s typical post on the same platform that month. 1× is usual; 5× is five times usual. The score uses +1 to handle zero counts. These are examples, not the statistical test.
Composio connects AI assistants and agents to business apps such as email, calendars, and CRMs. It handles authentication and tool access so developers can make agents take useful actions across those apps. Company site ↗
Who it sells to: AI developers and teams building business automations.
All 136 posts are counted below. Top 10 and bottom 10 use equal group sizes and rank public responses relative to this company’s month. The adjusted estimate uses all comparable posts, not only these extremes.
WHAT THE POST SAYS
Content types
This account uses product benefits and capabilities in 21% of its X posts. The highest category estimate is benchmarks and original data (9.8×); the lowest is company news and milestones (0.4×). These are directional estimates; the intervals below show how uncertain their size is. The table covers the whole content mix, including sparse categories.
Not enough comparable postsFewer than 5 posts on either side in overlapping months, or no usable variation.
HOW IT IS PRESENTED
Creative formats
This account uses text-led or link post in 43% of its X posts. The highest category estimate is chart or data table (4.2×); the lowest is people or event footage (0.6×). These are directional estimates; the intervals below show how uncertain their size is. The table covers the whole content mix, including sparse categories.
Media across all 136 posts
Text / link · 58 (43%)Still image · 41 (30%)Video · 37 (27%)
Not enough comparable postsFewer than 5 posts on either side in overlapping months, or no usable variation.
1× means similar response to this company’s other content on this platform, after accounting for month. The interval shows uncertainty; a result spanning 1× does not establish an advantage. Types and formats are analyzed separately, so this is association rather than an isolated causal effect.
Ranked by likes, comments and shares relative to the same company’s typical post on the same platform that month. 1× is usual; 5× is five times usual. The score uses +1 to handle zero counts. These are examples, not the statistical test.
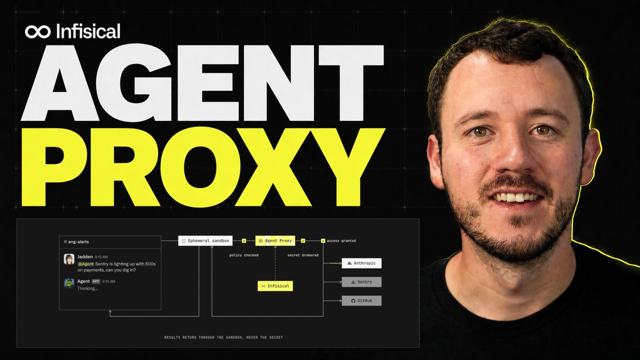
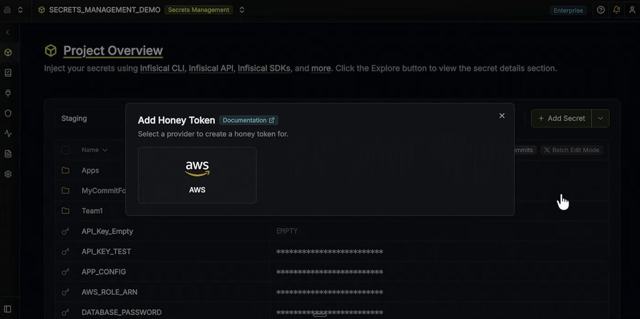
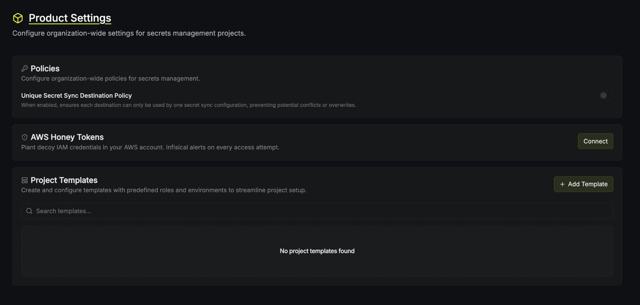
Infisical helps teams manage API keys, other software credentials, certificates, and privileged access. Its agent-related tools let software use services without exposing real credentials to the AI. Company site ↗
Who it sells to: Developers, platform teams, and security teams responsible for software access.
All 29 posts are counted below. Top 7 and bottom 7 use equal group sizes and rank public responses relative to this company’s month. The adjusted estimate uses all comparable posts, not only these extremes.
WHAT THE POST SAYS
Content types
This account uses product benefits and capabilities in 59% of its LinkedIn posts. The highest category estimate is product benefits and capabilities (1.3×); the lowest is events and community (0.7×). These are directional estimates; the intervals below show how uncertain their size is. The table covers the whole content mix, including sparse categories.
Not enough comparable postsFewer than 5 posts on either side in overlapping months, or no usable variation.
HOW IT IS PRESENTED
Creative formats
This account uses presenter explanation in 45% of its LinkedIn posts. Only presenter explanation has enough comparable repeated posts for an estimate: 1.0× versus its other content. These are directional estimates; the intervals below show how uncertain their size is. The table covers the whole content mix, including sparse categories.
Media across all 29 posts
Video · 17 (59%)Still image · 9 (31%)Text / link · 3 (10%)
Not enough comparable postsFewer than 5 posts on either side in overlapping months, or no usable variation.
1× means similar response to this company’s other content on this platform, after accounting for month. The interval shows uncertainty; a result spanning 1× does not establish an advantage. Types and formats are analyzed separately, so this is association rather than an isolated causal effect.
Ranked by likes, comments and shares relative to the same company’s typical post on the same platform that month. 1× is usual; 5× is five times usual. The score uses +1 to handle zero counts. These are examples, not the statistical test.
Infisical helps teams manage API keys, other software credentials, certificates, and privileged access. Its agent-related tools let software use services without exposing real credentials to the AI. Company site ↗
Who it sells to: Developers, platform teams, and security teams responsible for software access.
All 52 posts are counted below. Top 10 and bottom 10 use equal group sizes and rank public responses relative to this company’s month. The adjusted estimate uses all comparable posts, not only these extremes.
WHAT THE POST SAYS
Content types
This account uses product benefits and capabilities in 58% of its X posts. Only product benefits and capabilities has enough comparable repeated posts for an estimate: 1.3× versus its other content. These are directional estimates; the intervals below show how uncertain their size is. The table covers the whole content mix, including sparse categories.
Not enough comparable postsFewer than 5 posts on either side in overlapping months, or no usable variation.
HOW IT IS PRESENTED
Creative formats
This account uses presenter explanation in 29% of its X posts. The highest category estimate is presenter explanation (1.9×); the lowest is text-led or link post (0.5×). These are directional estimates; the intervals below show how uncertain their size is. The table covers the whole content mix, including sparse categories.
Media across all 52 posts
Video · 32 (62%)Text / link · 13 (25%)Still image · 7 (13%)
Not enough comparable postsFewer than 5 posts on either side in overlapping months, or no usable variation.
1× means similar response to this company’s other content on this platform, after accounting for month. The interval shows uncertainty; a result spanning 1× does not establish an advantage. Types and formats are analyzed separately, so this is association rather than an isolated causal effect.
Ranked by likes, comments and shares relative to the same company’s typical post on the same platform that month. 1× is usual; 5× is five times usual. The score uses +1 to handle zero counts. These are examples, not the statistical test.
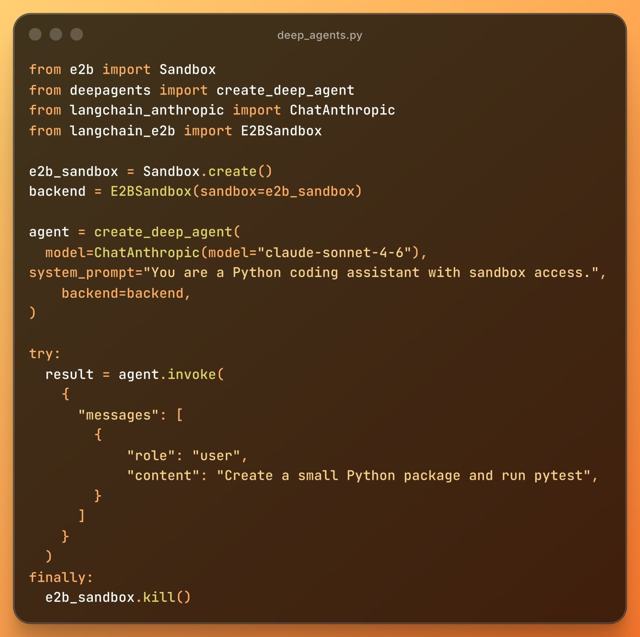
E2B provides isolated cloud computers where AI agents can run code, use browsers, and work with files. Developers can use these environments in E2B’s cloud or in their own infrastructure. Company site ↗
Who it sells to: Teams building AI products and operating agents at scale.
All 48 posts are counted below. Top 10 and bottom 10 use equal group sizes and rank public responses relative to this company’s month. The adjusted estimate uses all comparable posts, not only these extremes.
WHAT THE POST SAYS
Content types
This account uses product benefits and capabilities in 38% of its LinkedIn posts. The highest category estimate is company news and milestones (2.0×); the lowest is customer and user stories (0.9×). These are directional estimates; the intervals below show how uncertain their size is. The table covers the whole content mix, including sparse categories.
Not enough comparable postsFewer than 5 posts on either side in overlapping months, or no usable variation.
HOW IT IS PRESENTED
Creative formats
This account uses announcement card in 38% of its LinkedIn posts. The highest category estimate is announcement card (1.7×); the lowest is product demo or ui (0.6×). These are directional estimates; the intervals below show how uncertain their size is. The table covers the whole content mix, including sparse categories.
Media across all 48 posts
Still image · 21 (44%)Video · 18 (38%)Text / link · 9 (19%)
Not enough comparable postsFewer than 5 posts on either side in overlapping months, or no usable variation.
1× means similar response to this company’s other content on this platform, after accounting for month. The interval shows uncertainty; a result spanning 1× does not establish an advantage. Types and formats are analyzed separately, so this is association rather than an isolated causal effect.
Ranked by likes, comments and shares relative to the same company’s typical post on the same platform that month. 1× is usual; 5× is five times usual. The score uses +1 to handle zero counts. These are examples, not the statistical test.
E2B provides isolated cloud computers where AI agents can run code, use browsers, and work with files. Developers can use these environments in E2B’s cloud or in their own infrastructure. Company site ↗
Who it sells to: Teams building AI products and operating agents at scale.
All 57 posts are counted below. Top 10 and bottom 10 use equal group sizes and rank public responses relative to this company’s month. The adjusted estimate uses all comparable posts, not only these extremes.
WHAT THE POST SAYS
Content types
This account uses product benefits and capabilities in 40% of its X posts. The highest category estimate is company news and milestones (1.3×); the lowest is events and community (0.8×). These are directional estimates; the intervals below show how uncertain their size is. The table covers the whole content mix, including sparse categories.
Not enough comparable postsFewer than 5 posts on either side in overlapping months, or no usable variation.
HOW IT IS PRESENTED
Creative formats
This account uses text-led or link post in 58% of its X posts. The highest category estimate is product demo or ui (1.8×); the lowest is text-led or link post (0.6×). These are directional estimates; the intervals below show how uncertain their size is. The table covers the whole content mix, including sparse categories.
Media across all 57 posts
Text / link · 33 (58%)Still image · 15 (26%)Video · 9 (16%)
Not enough comparable postsFewer than 5 posts on either side in overlapping months, or no usable variation.
1× means similar response to this company’s other content on this platform, after accounting for month. The interval shows uncertainty; a result spanning 1× does not establish an advantage. Types and formats are analyzed separately, so this is association rather than an isolated causal effect.
Ranked by likes, comments and shares relative to the same company’s typical post on the same platform that month. 1× is usual; 5× is five times usual. The score uses +1 to handle zero counts. These are examples, not the statistical test.
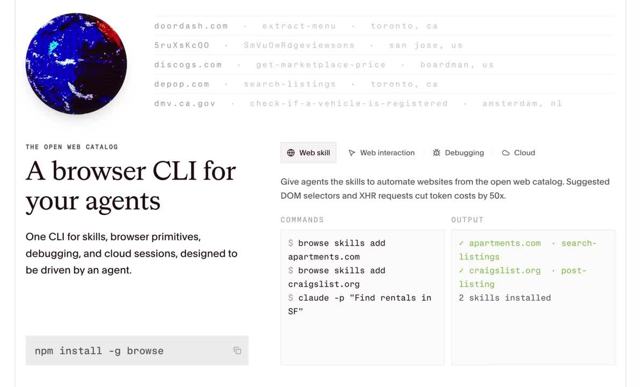
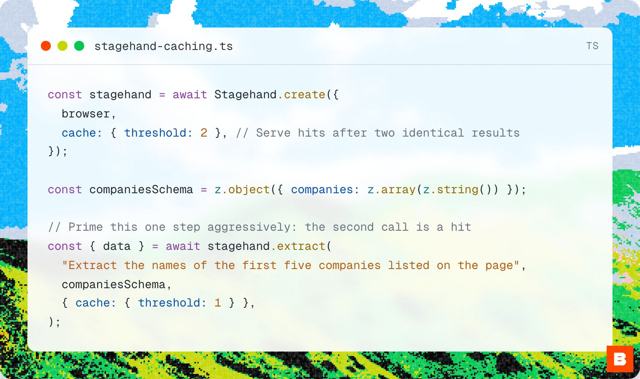
Browserbase gives AI agents cloud browsers and developer tools for navigating websites, filling forms, downloading files, and completing web tasks. It helps automate work on sites that do not provide a convenient API. Company site ↗
Who it sells to: AI developers and engineering teams building browser-based automation.
All 73 posts are counted below. Top 10 and bottom 10 use equal group sizes and rank public responses relative to this company’s month. The adjusted estimate uses all comparable posts, not only these extremes.
WHAT THE POST SAYS
Content types
This account uses events and community in 34% of its LinkedIn posts. The highest category estimate is events and community (1.1×); the lowest is customer and user stories (0.9×). These are directional estimates; the intervals below show how uncertain their size is. The table covers the whole content mix, including sparse categories.
Not enough comparable postsFewer than 5 posts on either side in overlapping months, or no usable variation.
HOW IT IS PRESENTED
Creative formats
This account uses announcement card in 34% of its LinkedIn posts. The highest category estimate is people or event footage (1.3×); the lowest is code or architecture diagram (0.6×). These are directional estimates; the intervals below show how uncertain their size is. The table covers the whole content mix, including sparse categories.
Media across all 73 posts
Still image · 38 (52%)Video · 33 (45%)Text / link · 2 (3%)
Not enough comparable postsFewer than 5 posts on either side in overlapping months, or no usable variation.
1× means similar response to this company’s other content on this platform, after accounting for month. The interval shows uncertainty; a result spanning 1× does not establish an advantage. Types and formats are analyzed separately, so this is association rather than an isolated causal effect.
Ranked by likes, comments and shares relative to the same company’s typical post on the same platform that month. 1× is usual; 5× is five times usual. The score uses +1 to handle zero counts. These are examples, not the statistical test.
Browserbase gives AI agents cloud browsers and developer tools for navigating websites, filling forms, downloading files, and completing web tasks. It helps automate work on sites that do not provide a convenient API. Company site ↗
Who it sells to: AI developers and engineering teams building browser-based automation.
All 91 posts are counted below. Top 10 and bottom 10 use equal group sizes and rank public responses relative to this company’s month. The adjusted estimate uses all comparable posts, not only these extremes.
WHAT THE POST SAYS
Content types
This account uses events and community in 35% of its X posts. The highest category estimate is product benefits and capabilities (1.1×); the lowest is engineering and operating lessons (0.7×). These are directional estimates; the intervals below show how uncertain their size is. The table covers the whole content mix, including sparse categories.
Not enough comparable postsFewer than 5 posts on either side in overlapping months, or no usable variation.
HOW IT IS PRESENTED
Creative formats
This account uses announcement card in 21% of its X posts. The highest category estimate is product demo or ui (2.0×); the lowest is text-led or link post (0.5×). These are directional estimates; the intervals below show how uncertain their size is. The table covers the whole content mix, including sparse categories.
Media across all 91 posts
Video · 43 (47%)Still image · 32 (35%)Text / link · 15 (16%)GIF · 1 (1%)
Not enough comparable postsFewer than 5 posts on either side in overlapping months, or no usable variation.
1× means similar response to this company’s other content on this platform, after accounting for month. The interval shows uncertainty; a result spanning 1× does not establish an advantage. Types and formats are analyzed separately, so this is association rather than an isolated causal effect.
Ranked by likes, comments and shares relative to the same company’s typical post on the same platform that month. 1× is usual; 5× is five times usual. The score uses +1 to handle zero counts. These are examples, not the statistical test.
Firecrawl helps AI applications collect and use web data. Its software can search websites, extract information from pages and documents, interact with sites, and monitor changes. Company site ↗
Who it sells to: Developers who need reliable external information for AI products and workflows.
All 60 posts are counted below. Top 10 and bottom 10 use equal group sizes and rank public responses relative to this company’s month. The adjusted estimate uses all comparable posts, not only these extremes.
WHAT THE POST SAYS
Content types
This account uses product benefits and capabilities in 67% of its LinkedIn posts. The highest category estimate is free tools and resources (1.3×); the lowest is product benefits and capabilities (1.0×). These are directional estimates; the intervals below show how uncertain their size is. The table covers the whole content mix, including sparse categories.
Not enough comparable postsFewer than 5 posts on either side in overlapping months, or no usable variation.
Insufficient context1 of 60 posts · 2%
0
1
Not enough comparable postsFewer than 5 posts on either side in overlapping months, or no usable variation.
HOW IT IS PRESENTED
Creative formats
This account uses product demo or ui in 60% of its LinkedIn posts. The highest category estimate is product demo or ui (1.0×); the lowest is announcement card (0.8×). These are directional estimates; the intervals below show how uncertain their size is. The table covers the whole content mix, including sparse categories.
Media across all 60 posts
Video · 51 (85%)Still image · 8 (13%)Text / link · 1 (2%)
Not enough comparable postsFewer than 5 posts on either side in overlapping months, or no usable variation.
1× means similar response to this company’s other content on this platform, after accounting for month. The interval shows uncertainty; a result spanning 1× does not establish an advantage. Types and formats are analyzed separately, so this is association rather than an isolated causal effect.
Ranked by likes, comments and shares relative to the same company’s typical post on the same platform that month. 1× is usual; 5× is five times usual. The score uses +1 to handle zero counts. These are examples, not the statistical test.
Firecrawl helps AI applications collect and use web data. Its software can search websites, extract information from pages and documents, interact with sites, and monitor changes. Company site ↗
Who it sells to: Developers who need reliable external information for AI products and workflows.
All 70 posts are counted below. Top 10 and bottom 10 use equal group sizes and rank public responses relative to this company’s month. The adjusted estimate uses all comparable posts, not only these extremes.
WHAT THE POST SAYS
Content types
This account uses product benefits and capabilities in 53% of its X posts. The highest category estimate is free tools and resources (3.8×); the lowest is company news and milestones (0.6×). These are directional estimates; the intervals below show how uncertain their size is. The table covers the whole content mix, including sparse categories.
Not enough comparable postsFewer than 5 posts on either side in overlapping months, or no usable variation.
HOW IT IS PRESENTED
Creative formats
This account uses product demo or ui in 46% of its X posts. The highest category estimate is product demo or ui (1.7×); the lowest is text-led or link post (0.4×). These are directional estimates; the intervals below show how uncertain their size is. The table covers the whole content mix, including sparse categories.
Media across all 70 posts
Video · 45 (64%)Text / link · 18 (26%)Still image · 7 (10%)
Not enough comparable postsFewer than 5 posts on either side in overlapping months, or no usable variation.
Unclear from available creative1 of 70 posts · 1%
0
0
Not enough comparable postsFewer than 5 posts on either side in overlapping months, or no usable variation.
1× means similar response to this company’s other content on this platform, after accounting for month. The interval shows uncertainty; a result spanning 1× does not establish an advantage. Types and formats are analyzed separately, so this is association rather than an isolated causal effect.
Ranked by likes, comments and shares relative to the same company’s typical post on the same platform that month. 1× is usual; 5× is five times usual. The score uses +1 to handle zero counts. These are examples, not the statistical test.
Braintrust helps AI teams inspect what their applications and agents are doing, test the quality of their outputs, and find problems before or after a release. It combines activity logs, evaluations, and tools for investigating failures. Company site ↗
Who it sells to: AI engineers and product teams responsible for the quality of deployed AI systems.
All 155 posts are counted below. Top 10 and bottom 10 use equal group sizes and rank public responses relative to this company’s month. The adjusted estimate uses all comparable posts, not only these extremes.
WHAT THE POST SAYS
Content types
This account uses product benefits and capabilities in 37% of its LinkedIn posts. The highest category estimate is customer and user stories (2.2×); the lowest is industry ideas and expert opinions (0.5×). These are directional estimates; the intervals below show how uncertain their size is. The table covers the whole content mix, including sparse categories.
Not enough comparable postsFewer than 5 posts on either side in overlapping months, or no usable variation.
HOW IT IS PRESENTED
Creative formats
This account uses announcement card in 28% of its LinkedIn posts. The highest category estimate is customer interview (4.4×); the lowest is article or video cover card (0.7×). These are directional estimates; the intervals below show how uncertain their size is. The table covers the whole content mix, including sparse categories.
Media across all 155 posts
Still image · 95 (61%)Video · 39 (25%)Document / slides · 13 (8%)Text / link · 8 (5%)
Not enough comparable postsFewer than 5 posts on either side in overlapping months, or no usable variation.
1× means similar response to this company’s other content on this platform, after accounting for month. The interval shows uncertainty; a result spanning 1× does not establish an advantage. Types and formats are analyzed separately, so this is association rather than an isolated causal effect.
Ranked by likes, comments and shares relative to the same company’s typical post on the same platform that month. 1× is usual; 5× is five times usual. The score uses +1 to handle zero counts. These are examples, not the statistical test.
Braintrust helps AI teams inspect what their applications and agents are doing, test the quality of their outputs, and find problems before or after a release. It combines activity logs, evaluations, and tools for investigating failures. Company site ↗
Who it sells to: AI engineers and product teams responsible for the quality of deployed AI systems.
All 157 posts are counted below. Top 10 and bottom 10 use equal group sizes and rank public responses relative to this company’s month. The adjusted estimate uses all comparable posts, not only these extremes.
WHAT THE POST SAYS
Content types
This account uses product benefits and capabilities in 38% of its X posts. The highest category estimate is benchmarks and original data (1.8×); the lowest is tutorials and practical education (0.5×). These are directional estimates; the intervals below show how uncertain their size is. The table covers the whole content mix, including sparse categories.
Not enough comparable postsFewer than 5 posts on either side in overlapping months, or no usable variation.
HOW IT IS PRESENTED
Creative formats
This account uses text-led or link post in 25% of its X posts. The highest category estimate is chart or data table (1.6×); the lowest is customer quote card (0.6×). These are directional estimates; the intervals below show how uncertain their size is. The table covers the whole content mix, including sparse categories.
Media across all 157 posts
Still image · 70 (45%)Video · 47 (30%)Text / link · 40 (25%)
Not enough comparable postsFewer than 5 posts on either side in overlapping months, or no usable variation.
1× means similar response to this company’s other content on this platform, after accounting for month. The interval shows uncertainty; a result spanning 1× does not establish an advantage. Types and formats are analyzed separately, so this is association rather than an isolated causal effect.
Ranked by likes, comments and shares relative to the same company’s typical post on the same platform that month. 1× is usual; 5× is five times usual. The score uses +1 to handle zero counts. These are examples, not the statistical test.
WorkOS sells authentication and enterprise-readiness tools for software products. Examples include company single sign-on, user provisioning, access controls, and audit logs. Company site ↗
Who it sells to: Developers and software companies that need to serve enterprise customers.
All 208 posts are counted below. Top 10 and bottom 10 use equal group sizes and rank public responses relative to this company’s month. The adjusted estimate uses all comparable posts, not only these extremes.
WHAT THE POST SAYS
Content types
This account uses events and community in 43% of its LinkedIn posts. The highest category estimate is people, careers, and company culture (3.2×); the lowest is tutorials and practical education (0.7×). These are directional estimates; the intervals below show how uncertain their size is. The table covers the whole content mix, including sparse categories.
Not enough comparable postsFewer than 5 posts on either side in overlapping months, or no usable variation.
HOW IT IS PRESENTED
Creative formats
This account uses announcement card in 42% of its LinkedIn posts. The highest category estimate is people or event footage (1.5×); the lowest is article or video cover card (0.6×). These are directional estimates; the intervals below show how uncertain their size is. The table covers the whole content mix, including sparse categories.
Media across all 208 posts
Video · 94 (45%)Still image · 79 (38%)Text / link · 30 (14%)Document / slides · 5 (2%)
Not enough comparable postsFewer than 5 posts on either side in overlapping months, or no usable variation.
1× means similar response to this company’s other content on this platform, after accounting for month. The interval shows uncertainty; a result spanning 1× does not establish an advantage. Types and formats are analyzed separately, so this is association rather than an isolated causal effect.
Ranked by likes, comments and shares relative to the same company’s typical post on the same platform that month. 1× is usual; 5× is five times usual. The score uses +1 to handle zero counts. These are examples, not the statistical test.
WorkOS sells authentication and enterprise-readiness tools for software products. Examples include company single sign-on, user provisioning, access controls, and audit logs. Company site ↗
Who it sells to: Developers and software companies that need to serve enterprise customers.
All 214 posts are counted below. Top 10 and bottom 10 use equal group sizes and rank public responses relative to this company’s month. The adjusted estimate uses all comparable posts, not only these extremes.
WHAT THE POST SAYS
Content types
This account uses events and community in 44% of its X posts. The highest category estimate is engineering and operating lessons (1.4×); the lowest is industry ideas and expert opinions (0.8×). These are directional estimates; the intervals below show how uncertain their size is. The table covers the whole content mix, including sparse categories.
Not enough comparable postsFewer than 5 posts on either side in overlapping months, or no usable variation.
HOW IT IS PRESENTED
Creative formats
This account uses text-led or link post in 31% of its X posts. The highest category estimate is recorded technical talk (1.6×); the lowest is text-led or link post (0.8×). These are directional estimates; the intervals below show how uncertain their size is. The table covers the whole content mix, including sparse categories.
Media across all 214 posts
Video · 84 (39%)Text / link · 65 (30%)Still image · 61 (29%)GIF · 4 (2%)
Not enough comparable postsFewer than 5 posts on either side in overlapping months, or no usable variation.
1× means similar response to this company’s other content on this platform, after accounting for month. The interval shows uncertainty; a result spanning 1× does not establish an advantage. Types and formats are analyzed separately, so this is association rather than an isolated causal effect.
Ranked by likes, comments and shares relative to the same company’s typical post on the same platform that month. 1× is usual; 5× is five times usual. The score uses +1 to handle zero counts. These are examples, not the statistical test.
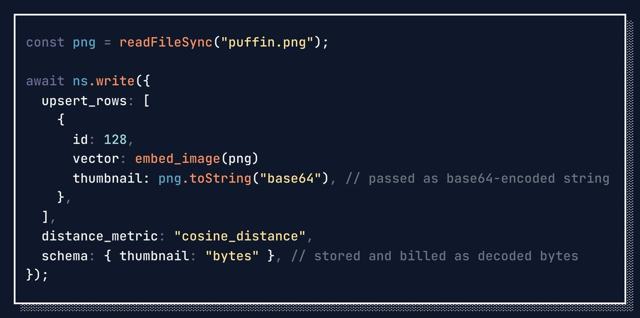
turbopuffer provides a database for searching large collections of text and other data, including searching by meaning rather than exact words. AI and software teams use it to retrieve information quickly at scale. Company site ↗
Who it sells to: Engineering teams building search, retrieval, and data-intensive AI products.
All 53 posts are counted below. Top 10 and bottom 10 use equal group sizes and rank public responses relative to this company’s month. The adjusted estimate uses all comparable posts, not only these extremes.
WHAT THE POST SAYS
Content types
This account uses product benefits and capabilities in 58% of its LinkedIn posts. The highest category estimate is engineering and operating lessons (1.7×); the lowest is product benefits and capabilities (0.6×). These are directional estimates; the intervals below show how uncertain their size is. The table covers the whole content mix, including sparse categories.
Not enough comparable postsFewer than 5 posts on either side in overlapping months, or no usable variation.
Insufficient context1 of 53 posts · 2%
1
0
Not enough comparable postsFewer than 5 posts on either side in overlapping months, or no usable variation.
HOW IT IS PRESENTED
Creative formats
This account uses announcement card in 25% of its LinkedIn posts. The highest category estimate is article or video cover card (1.2×); the lowest is announcement card (0.6×). These are directional estimates; the intervals below show how uncertain their size is. The table covers the whole content mix, including sparse categories.
Media across all 53 posts
Still image · 34 (64%)Text / link · 16 (30%)Video · 3 (6%)
Not enough comparable postsFewer than 5 posts on either side in overlapping months, or no usable variation.
1× means similar response to this company’s other content on this platform, after accounting for month. The interval shows uncertainty; a result spanning 1× does not establish an advantage. Types and formats are analyzed separately, so this is association rather than an isolated causal effect.
Ranked by likes, comments and shares relative to the same company’s typical post on the same platform that month. 1× is usual; 5× is five times usual. The score uses +1 to handle zero counts. These are examples, not the statistical test.
turbopuffer provides a database for searching large collections of text and other data, including searching by meaning rather than exact words. AI and software teams use it to retrieve information quickly at scale. Company site ↗
Who it sells to: Engineering teams building search, retrieval, and data-intensive AI products.
All 62 posts are counted below. Top 10 and bottom 10 use equal group sizes and rank public responses relative to this company’s month. The adjusted estimate uses all comparable posts, not only these extremes.
WHAT THE POST SAYS
Content types
This account uses product benefits and capabilities in 52% of its X posts. The highest category estimate is engineering and operating lessons (1.7×); the lowest is product benefits and capabilities (0.6×). These are directional estimates; the intervals below show how uncertain their size is. The table covers the whole content mix, including sparse categories.
Not enough comparable postsFewer than 5 posts on either side in overlapping months, or no usable variation.
Insufficient context1 of 62 posts · 2%
1
0
Not enough comparable postsFewer than 5 posts on either side in overlapping months, or no usable variation.
HOW IT IS PRESENTED
Creative formats
This account uses text-led or link post in 37% of its X posts. The highest category estimate is text-led or link post (1.4×); the lowest is announcement card (0.4×). These are directional estimates; the intervals below show how uncertain their size is. The table covers the whole content mix, including sparse categories.
Media across all 62 posts
Still image · 34 (55%)Text / link · 23 (37%)Video · 5 (8%)
Not enough comparable postsFewer than 5 posts on either side in overlapping months, or no usable variation.
1× means similar response to this company’s other content on this platform, after accounting for month. The interval shows uncertainty; a result spanning 1× does not establish an advantage. Types and formats are analyzed separately, so this is association rather than an isolated causal effect.
Ranked by likes, comments and shares relative to the same company’s typical post on the same platform that month. 1× is usual; 5× is five times usual. The score uses +1 to handle zero counts. These are examples, not the statistical test.
Daytona provides isolated cloud computers where AI agents can run code, use browsers and work with files. Its APIs let developers create, pause, resume and scale these execution environments. Company site ↗
Who it sells to: AI developers and platform teams running agents in production.
All 98 posts are counted below. Top 10 and bottom 10 use equal group sizes and rank public responses relative to this company’s month. The adjusted estimate uses all comparable posts, not only these extremes.
WHAT THE POST SAYS
Content types
This account uses events and community in 74% of its LinkedIn posts. The highest category estimate is product benefits and capabilities (1.0×); the lowest is events and community (0.9×). These are directional estimates; the intervals below show how uncertain their size is. The table covers the whole content mix, including sparse categories.
Not enough comparable postsFewer than 5 posts on either side in overlapping months, or no usable variation.
HOW IT IS PRESENTED
Creative formats
This account uses people or event footage in 42% of its LinkedIn posts. The highest category estimate is people or event footage (1.5×); the lowest is announcement card (0.7×). These are directional estimates; the intervals below show how uncertain their size is. The table covers the whole content mix, including sparse categories.
Media across all 98 posts
Still image · 87 (89%)Video · 6 (6%)Text / link · 5 (5%)
Not enough comparable postsFewer than 5 posts on either side in overlapping months, or no usable variation.
1× means similar response to this company’s other content on this platform, after accounting for month. The interval shows uncertainty; a result spanning 1× does not establish an advantage. Types and formats are analyzed separately, so this is association rather than an isolated causal effect.
Ranked by likes, comments and shares relative to the same company’s typical post on the same platform that month. 1× is usual; 5× is five times usual. The score uses +1 to handle zero counts. These are examples, not the statistical test.
Daytona provides isolated cloud computers where AI agents can run code, use browsers and work with files. Its APIs let developers create, pause, resume and scale these execution environments. Company site ↗
Who it sells to: AI developers and platform teams running agents in production.
All 149 posts are counted below. Top 10 and bottom 10 use equal group sizes and rank public responses relative to this company’s month. The adjusted estimate uses all comparable posts, not only these extremes.
WHAT THE POST SAYS
Content types
This account uses events and community in 58% of its X posts. The highest category estimate is product benefits and capabilities (2.0×); the lowest is events and community (0.5×). These are directional estimates; the intervals below show how uncertain their size is. The table covers the whole content mix, including sparse categories.
Not enough comparable postsFewer than 5 posts on either side in overlapping months, or no usable variation.
HOW IT IS PRESENTED
Creative formats
This account uses text-led or link post in 34% of its X posts. The highest category estimate is article or video cover card (1.6×); the lowest is text-led or link post (0.6×). These are directional estimates; the intervals below show how uncertain their size is. The table covers the whole content mix, including sparse categories.
Media across all 149 posts
Still image · 92 (62%)Text / link · 50 (34%)Video · 6 (4%)GIF · 1 (1%)
Not enough comparable postsFewer than 5 posts on either side in overlapping months, or no usable variation.
1× means similar response to this company’s other content on this platform, after accounting for month. The interval shows uncertainty; a result spanning 1× does not establish an advantage. Types and formats are analyzed separately, so this is association rather than an isolated causal effect.
Ranked by likes, comments and shares relative to the same company’s typical post on the same platform that month. 1× is usual; 5× is five times usual. The score uses +1 to handle zero counts. These are examples, not the statistical test.
Arcade.dev provides authenticated tools and an action runtime for AI agents. Teams use it to connect agents to business systems while enforcing access, security and governance policies. Company site ↗
Who it sells to: Teams building enterprise agents and governing access to business software.
All 138 posts are counted below. Top 10 and bottom 10 use equal group sizes and rank public responses relative to this company’s month. The adjusted estimate uses all comparable posts, not only these extremes.
WHAT THE POST SAYS
Content types
This account uses industry ideas and expert opinions in 29% of its LinkedIn posts. The highest category estimate is company news and milestones (2.8×); the lowest is industry ideas and expert opinions (0.8×). These are directional estimates; the intervals below show how uncertain their size is. The table covers the whole content mix, including sparse categories.
Not enough comparable postsFewer than 5 posts on either side in overlapping months, or no usable variation.
HOW IT IS PRESENTED
Creative formats
This account uses article or video cover card in 49% of its LinkedIn posts. The highest category estimate is people or event footage (1.7×); the lowest is expert or founder interview (0.7×). These are directional estimates; the intervals below show how uncertain their size is. The table covers the whole content mix, including sparse categories.
Media across all 138 posts
Still image · 81 (59%)Video · 30 (22%)Text / link · 26 (19%)Document / slides · 1 (1%)
Not enough comparable postsFewer than 5 posts on either side in overlapping months, or no usable variation.
1× means similar response to this company’s other content on this platform, after accounting for month. The interval shows uncertainty; a result spanning 1× does not establish an advantage. Types and formats are analyzed separately, so this is association rather than an isolated causal effect.
Ranked by likes, comments and shares relative to the same company’s typical post on the same platform that month. 1× is usual; 5× is five times usual. The score uses +1 to handle zero counts. These are examples, not the statistical test.
Arcade.dev provides authenticated tools and an action runtime for AI agents. Teams use it to connect agents to business systems while enforcing access, security and governance policies. Company site ↗
Who it sells to: Teams building enterprise agents and governing access to business software.
All 127 posts are counted below. Top 10 and bottom 10 use equal group sizes and rank public responses relative to this company’s month. The adjusted estimate uses all comparable posts, not only these extremes.
WHAT THE POST SAYS
Content types
This account uses industry ideas and expert opinions in 28% of its X posts. The highest category estimate is company news and milestones (3.3×); the lowest is product benefits and capabilities (0.8×). These are directional estimates; the intervals below show how uncertain their size is. The table covers the whole content mix, including sparse categories.
Not enough comparable postsFewer than 5 posts on either side in overlapping months, or no usable variation.
HOW IT IS PRESENTED
Creative formats
This account uses article or video cover card in 38% of its X posts. The highest category estimate is chart or data table (1.3×); the lowest is article or video cover card (0.9×). These are directional estimates; the intervals below show how uncertain their size is. The table covers the whole content mix, including sparse categories.
Media across all 127 posts
Still image · 89 (70%)Video · 25 (20%)Text / link · 13 (10%)
Not enough comparable postsFewer than 5 posts on either side in overlapping months, or no usable variation.
1× means similar response to this company’s other content on this platform, after accounting for month. The interval shows uncertainty; a result spanning 1× does not establish an advantage. Types and formats are analyzed separately, so this is association rather than an isolated causal effect.
Ranked by likes, comments and shares relative to the same company’s typical post on the same platform that month. 1× is usual; 5× is five times usual. The score uses +1 to handle zero counts. These are examples, not the statistical test.
Trigger.dev runs background tasks, long-running workflows and AI agents. It handles queues, retries, scheduling, observability and scaling so developers can focus on application code. Company site ↗
Who it sells to: Software developers building production AI workflows and applications.
All 33 posts are counted below. Top 8 and bottom 8 use equal group sizes and rank public responses relative to this company’s month. The adjusted estimate uses all comparable posts, not only these extremes.
WHAT THE POST SAYS
Content types
This account uses product benefits and capabilities in 61% of its LinkedIn posts. Only product benefits and capabilities has enough comparable repeated posts for an estimate: 0.7× versus its other content. These are directional estimates; the intervals below show how uncertain their size is. The table covers the whole content mix, including sparse categories.
Not enough comparable postsFewer than 5 posts on either side in overlapping months, or no usable variation.
HOW IT IS PRESENTED
Creative formats
This account uses article or video cover card in 61% of its LinkedIn posts. Only article or video cover card has enough comparable repeated posts for an estimate: 0.9× versus its other content. These are directional estimates; the intervals below show how uncertain their size is. The table covers the whole content mix, including sparse categories.
Media across all 33 posts
Text / link · 16 (48%)Still image · 12 (36%)Video · 5 (15%)
Not enough comparable postsFewer than 5 posts on either side in overlapping months, or no usable variation.
1× means similar response to this company’s other content on this platform, after accounting for month. The interval shows uncertainty; a result spanning 1× does not establish an advantage. Types and formats are analyzed separately, so this is association rather than an isolated causal effect.
Ranked by likes, comments and shares relative to the same company’s typical post on the same platform that month. 1× is usual; 5× is five times usual. The score uses +1 to handle zero counts. These are examples, not the statistical test.
Trigger.dev runs background tasks, long-running workflows and AI agents. It handles queues, retries, scheduling, observability and scaling so developers can focus on application code. Company site ↗
Who it sells to: Software developers building production AI workflows and applications.
All 31 posts are counted below. Top 7 and bottom 7 use equal group sizes and rank public responses relative to this company’s month. The adjusted estimate uses all comparable posts, not only these extremes.
WHAT THE POST SAYS
Content types
This account uses product benefits and capabilities in 65% of its X posts. Only product benefits and capabilities has enough comparable repeated posts for an estimate: 0.5× versus its other content. These are directional estimates; the intervals below show how uncertain their size is. The table covers the whole content mix, including sparse categories.
Not enough comparable postsFewer than 5 posts on either side in overlapping months, or no usable variation.
Insufficient context1 of 31 posts · 3%
0
1
Not enough comparable postsFewer than 5 posts on either side in overlapping months, or no usable variation.
HOW IT IS PRESENTED
Creative formats
This account uses text-led or link post in 42% of its X posts. The highest category estimate is text-led or link post (1.3×); the lowest is article or video cover card (0.9×). These are directional estimates; the intervals below show how uncertain their size is. The table covers the whole content mix, including sparse categories.
Media across all 31 posts
Text / link · 13 (42%)Still image · 12 (39%)Video · 6 (19%)
Not enough comparable postsFewer than 5 posts on either side in overlapping months, or no usable variation.
1× means similar response to this company’s other content on this platform, after accounting for month. The interval shows uncertainty; a result spanning 1× does not establish an advantage. Types and formats are analyzed separately, so this is association rather than an isolated causal effect.
Ranked by likes, comments and shares relative to the same company’s typical post on the same platform that month. 1× is usual; 5× is five times usual. The score uses +1 to handle zero counts. These are examples, not the statistical test.
Patronus AI develops evaluations, simulated environments and training data for AI agents. Its research and software help teams test model behavior and improve agent reliability. Company site ↗
Who it sells to: AI researchers and engineering teams evaluating, training and deploying agents.
All 33 posts are counted below. Top 8 and bottom 8 use equal group sizes and rank public responses relative to this company’s month. The adjusted estimate uses all comparable posts, not only these extremes.
WHAT THE POST SAYS
Content types
This account uses people, careers, and company culture in 30% of its LinkedIn posts. The highest category estimate is company news and milestones (1.9×); the lowest is people, careers, and company culture (0.9×). These are directional estimates; the intervals below show how uncertain their size is. The table covers the whole content mix, including sparse categories.
Not enough comparable postsFewer than 5 posts on either side in overlapping months, or no usable variation.
HOW IT IS PRESENTED
Creative formats
This account uses people or event footage in 30% of its LinkedIn posts. The highest category estimate is people or event footage (1.2×); the lowest is article or video cover card (0.9×). These are directional estimates; the intervals below show how uncertain their size is. The table covers the whole content mix, including sparse categories.
Media across all 33 posts
Still image · 19 (58%)Video · 11 (33%)Text / link · 3 (9%)
Not enough comparable postsFewer than 5 posts on either side in overlapping months, or no usable variation.
1× means similar response to this company’s other content on this platform, after accounting for month. The interval shows uncertainty; a result spanning 1× does not establish an advantage. Types and formats are analyzed separately, so this is association rather than an isolated causal effect.
Ranked by likes, comments and shares relative to the same company’s typical post on the same platform that month. 1× is usual; 5× is five times usual. The score uses +1 to handle zero counts. These are examples, not the statistical test.
Patronus AI develops evaluations, simulated environments and training data for AI agents. Its research and software help teams test model behavior and improve agent reliability. Company site ↗
Who it sells to: AI researchers and engineering teams evaluating, training and deploying agents.
All 30 posts are counted below. Top 7 and bottom 7 use equal group sizes and rank public responses relative to this company’s month. The adjusted estimate uses all comparable posts, not only these extremes.
WHAT THE POST SAYS
Content types
This account uses people, careers, and company culture in 30% of its X posts. The highest category estimate is company news and milestones (1.9×); the lowest is people, careers, and company culture (0.7×). These are directional estimates; the intervals below show how uncertain their size is. The table covers the whole content mix, including sparse categories.
Not enough comparable postsFewer than 5 posts on either side in overlapping months, or no usable variation.
HOW IT IS PRESENTED
Creative formats
This account uses people or event footage in 33% of its X posts. The highest category estimate is article or video cover card (1.2×); the lowest is people or event footage (0.5×). These are directional estimates; the intervals below show how uncertain their size is. The table covers the whole content mix, including sparse categories.
Media across all 30 posts
Still image · 18 (60%)Video · 11 (37%)Text / link · 1 (3%)
Not enough comparable postsFewer than 5 posts on either side in overlapping months, or no usable variation.
1× means similar response to this company’s other content on this platform, after accounting for month. The interval shows uncertainty; a result spanning 1× does not establish an advantage. Types and formats are analyzed separately, so this is association rather than an isolated causal effect.
Ranked by likes, comments and shares relative to the same company’s typical post on the same platform that month. 1× is usual; 5× is five times usual. The score uses +1 to handle zero counts. These are examples, not the statistical test.
Fiddler AI helps enterprises evaluate, monitor and govern AI models and agents. Its platform combines observability, guardrails, policy controls and tools for investigating production behavior. Company site ↗
Who it sells to: Enterprise AI engineering, platform, security and governance teams.
All 65 posts are counted below. Top 10 and bottom 10 use equal group sizes and rank public responses relative to this company’s month. The adjusted estimate uses all comparable posts, not only these extremes.
WHAT THE POST SAYS
Content types
This account uses events and community in 42% of its LinkedIn posts. The highest category estimate is product benefits and capabilities (1.3×); the lowest is customer and user stories (0.6×). These are directional estimates; the intervals below show how uncertain their size is. The table covers the whole content mix, including sparse categories.
Not enough comparable postsFewer than 5 posts on either side in overlapping months, or no usable variation.
HOW IT IS PRESENTED
Creative formats
This account uses article or video cover card in 71% of its LinkedIn posts. The highest category estimate is article or video cover card (1.1×); the lowest is expert or founder interview (0.7×). These are directional estimates; the intervals below show how uncertain their size is. The table covers the whole content mix, including sparse categories.
Media across all 65 posts
Still image · 27 (42%)Text / link · 26 (40%)Video · 12 (18%)
Not enough comparable postsFewer than 5 posts on either side in overlapping months, or no usable variation.
1× means similar response to this company’s other content on this platform, after accounting for month. The interval shows uncertainty; a result spanning 1× does not establish an advantage. Types and formats are analyzed separately, so this is association rather than an isolated causal effect.
Ranked by likes, comments and shares relative to the same company’s typical post on the same platform that month. 1× is usual; 5× is five times usual. The score uses +1 to handle zero counts. These are examples, not the statistical test.
Fiddler AI helps enterprises evaluate, monitor and govern AI models and agents. Its platform combines observability, guardrails, policy controls and tools for investigating production behavior. Company site ↗
Who it sells to: Enterprise AI engineering, platform, security and governance teams.
All 36 posts are counted below. Top 9 and bottom 9 use equal group sizes and rank public responses relative to this company’s month. The adjusted estimate uses all comparable posts, not only these extremes.
WHAT THE POST SAYS
Content types
This account uses events and community in 44% of its X posts. The highest category estimate is product benefits and capabilities (2.8×); the lowest is industry ideas and expert opinions (0.7×). These are directional estimates; the intervals below show how uncertain their size is. The table covers the whole content mix, including sparse categories.
Not enough comparable postsFewer than 5 posts on either side in overlapping months, or no usable variation.
HOW IT IS PRESENTED
Creative formats
This account uses text-led or link post in 47% of its X posts. The highest category estimate is text-led or link post (1.1×); the lowest is article or video cover card (1.0×). These are directional estimates; the intervals below show how uncertain their size is. The table covers the whole content mix, including sparse categories.
Media across all 36 posts
Text / link · 17 (47%)Still image · 11 (31%)Video · 8 (22%)
Not enough comparable postsFewer than 5 posts on either side in overlapping months, or no usable variation.
1× means similar response to this company’s other content on this platform, after accounting for month. The interval shows uncertainty; a result spanning 1× does not establish an advantage. Types and formats are analyzed separately, so this is association rather than an isolated causal effect.
Ranked by likes, comments and shares relative to the same company’s typical post on the same platform that month. 1× is usual; 5× is five times usual. The score uses +1 to handle zero counts. These are examples, not the statistical test.
Convex provides an application backend and database with real-time data updates and server-side functions. Developers use it to build and operate web applications without assembling a separate backend infrastructure stack. Company site ↗
Who it sells to: Developers and software teams building applications, including AI-powered products.
All 60 posts are counted below. Top 10 and bottom 10 use equal group sizes and rank public responses relative to this company’s month. The adjusted estimate uses all comparable posts, not only these extremes.
WHAT THE POST SAYS
Content types
This account uses events and community in 42% of its LinkedIn posts. The highest category estimate is product benefits and capabilities (1.5×); the lowest is events and community (0.4×). These are directional estimates; the intervals below show how uncertain their size is. The table covers the whole content mix, including sparse categories.
Not enough comparable postsFewer than 5 posts on either side in overlapping months, or no usable variation.
HOW IT IS PRESENTED
Creative formats
This account uses article or video cover card in 23% of its LinkedIn posts. The highest category estimate is article or video cover card (1.4×); the lowest is text-led or link post (0.5×). These are directional estimates; the intervals below show how uncertain their size is. The table covers the whole content mix, including sparse categories.
Media across all 60 posts
Still image · 26 (43%)Video · 24 (40%)Text / link · 10 (17%)
Not enough comparable postsFewer than 5 posts on either side in overlapping months, or no usable variation.
1× means similar response to this company’s other content on this platform, after accounting for month. The interval shows uncertainty; a result spanning 1× does not establish an advantage. Types and formats are analyzed separately, so this is association rather than an isolated causal effect.
Ranked by likes, comments and shares relative to the same company’s typical post on the same platform that month. 1× is usual; 5× is five times usual. The score uses +1 to handle zero counts. These are examples, not the statistical test.
Convex provides an application backend and database with real-time data updates and server-side functions. Developers use it to build and operate web applications without assembling a separate backend infrastructure stack. Company site ↗
Who it sells to: Developers and software teams building applications, including AI-powered products.
All 86 posts are counted below. Top 10 and bottom 10 use equal group sizes and rank public responses relative to this company’s month. The adjusted estimate uses all comparable posts, not only these extremes.
WHAT THE POST SAYS
Content types
This account uses events and community in 26% of its X posts. The highest category estimate is product benefits and capabilities (2.0×); the lowest is events and community (0.5×). These are directional estimates; the intervals below show how uncertain their size is. The table covers the whole content mix, including sparse categories.
Not enough comparable postsFewer than 5 posts on either side in overlapping months, or no usable variation.
HOW IT IS PRESENTED
Creative formats
This account uses text-led or link post in 49% of its X posts. The highest category estimate is presenter explanation (2.0×); the lowest is text-led or link post (0.5×). These are directional estimates; the intervals below show how uncertain their size is. The table covers the whole content mix, including sparse categories.
Media across all 86 posts
Text / link · 42 (49%)Video · 27 (31%)Still image · 14 (16%)GIF · 3 (3%)
Not enough comparable postsFewer than 5 posts on either side in overlapping months, or no usable variation.
1× means similar response to this company’s other content on this platform, after accounting for month. The interval shows uncertainty; a result spanning 1× does not establish an advantage. Types and formats are analyzed separately, so this is association rather than an isolated causal effect.
Ranked by likes, comments and shares relative to the same company’s typical post on the same platform that month. 1× is usual; 5× is five times usual. The score uses +1 to handle zero counts. These are examples, not the statistical test.
LlamaIndex provides document parsing, extraction and data infrastructure for AI applications. Its LlamaParse software turns complex enterprise documents into structured information and context that agents can use. Company site ↗
Who it sells to: AI developers and enterprise teams building document-intensive workflows.
All 126 posts are counted below. Top 10 and bottom 10 use equal group sizes and rank public responses relative to this company’s month. The adjusted estimate uses all comparable posts, not only these extremes.
WHAT THE POST SAYS
Content types
This account uses product benefits and capabilities in 37% of its LinkedIn posts. The highest category estimate is product benefits and capabilities (1.3×); the lowest is events and community (0.6×). These are directional estimates; the intervals below show how uncertain their size is. The table covers the whole content mix, including sparse categories.
Not enough comparable postsFewer than 5 posts on either side in overlapping months, or no usable variation.
HOW IT IS PRESENTED
Creative formats
This account uses article or video cover card in 32% of its LinkedIn posts. The highest category estimate is presenter explanation (1.4×); the lowest is announcement card (0.7×). These are directional estimates; the intervals below show how uncertain their size is. The table covers the whole content mix, including sparse categories.
Media across all 126 posts
Still image · 83 (66%)Video · 29 (23%)Text / link · 12 (10%)Document / slides · 2 (2%)
Not enough comparable postsFewer than 5 posts on either side in overlapping months, or no usable variation.
1× means similar response to this company’s other content on this platform, after accounting for month. The interval shows uncertainty; a result spanning 1× does not establish an advantage. Types and formats are analyzed separately, so this is association rather than an isolated causal effect.
Ranked by likes, comments and shares relative to the same company’s typical post on the same platform that month. 1× is usual; 5× is five times usual. The score uses +1 to handle zero counts. These are examples, not the statistical test.
LlamaIndex provides document parsing, extraction and data infrastructure for AI applications. Its LlamaParse software turns complex enterprise documents into structured information and context that agents can use. Company site ↗
Who it sells to: AI developers and enterprise teams building document-intensive workflows.
All 115 posts are counted below. Top 10 and bottom 10 use equal group sizes and rank public responses relative to this company’s month. The adjusted estimate uses all comparable posts, not only these extremes.
WHAT THE POST SAYS
Content types
This account uses product benefits and capabilities in 40% of its X posts. The highest category estimate is product benefits and capabilities (1.7×); the lowest is events and community (0.4×). These are directional estimates; the intervals below show how uncertain their size is. The table covers the whole content mix, including sparse categories.
Not enough comparable postsFewer than 5 posts on either side in overlapping months, or no usable variation.
HOW IT IS PRESENTED
Creative formats
This account uses product demo or ui in 27% of its X posts. The highest category estimate is product demo or ui (1.6×); the lowest is people or event footage (0.5×). These are directional estimates; the intervals below show how uncertain their size is. The table covers the whole content mix, including sparse categories.
Media across all 115 posts
Still image · 74 (64%)Video · 28 (24%)Text / link · 13 (11%)
Not enough comparable postsFewer than 5 posts on either side in overlapping months, or no usable variation.
1× means similar response to this company’s other content on this platform, after accounting for month. The interval shows uncertainty; a result spanning 1× does not establish an advantage. Types and formats are analyzed separately, so this is association rather than an isolated causal effect.
Ranked by likes, comments and shares relative to the same company’s typical post on the same platform that month. 1× is usual; 5× is five times usual. The score uses +1 to handle zero counts. These are examples, not the statistical test.
CrewAI provides an open-source framework and an enterprise platform for building, coordinating and operating AI agents. Teams use it to create multi-agent workflows and manage their deployment and governance. Company site ↗
Who it sells to: Developers and enterprise teams building and operating agent-based automation.
All 62 posts are counted below. Top 10 and bottom 10 use equal group sizes and rank public responses relative to this company’s month. The adjusted estimate uses all comparable posts, not only these extremes.
WHAT THE POST SAYS
Content types
This account uses events and community in 47% of its LinkedIn posts. The highest category estimate is product benefits and capabilities (1.3×); the lowest is events and community (0.8×). These are directional estimates; the intervals below show how uncertain their size is. The table covers the whole content mix, including sparse categories.
Not enough comparable postsFewer than 5 posts on either side in overlapping months, or no usable variation.
HOW IT IS PRESENTED
Creative formats
This account uses article or video cover card in 50% of its LinkedIn posts. The highest category estimate is article or video cover card (1.3×); the lowest is text-led or link post (0.5×). These are directional estimates; the intervals below show how uncertain their size is. The table covers the whole content mix, including sparse categories.
Media across all 62 posts
Still image · 39 (63%)Text / link · 15 (24%)Video · 7 (11%)Document / slides · 1 (2%)
Not enough comparable postsFewer than 5 posts on either side in overlapping months, or no usable variation.
1× means similar response to this company’s other content on this platform, after accounting for month. The interval shows uncertainty; a result spanning 1× does not establish an advantage. Types and formats are analyzed separately, so this is association rather than an isolated causal effect.
Ranked by likes, comments and shares relative to the same company’s typical post on the same platform that month. 1× is usual; 5× is five times usual. The score uses +1 to handle zero counts. These are examples, not the statistical test.
CrewAI provides an open-source framework and an enterprise platform for building, coordinating and operating AI agents. Teams use it to create multi-agent workflows and manage their deployment and governance. Company site ↗
Who it sells to: Developers and enterprise teams building and operating agent-based automation.
All 2 posts are counted below. Top 1 and bottom 1 use equal group sizes and rank public responses relative to this company’s month. The adjusted estimate uses all comparable posts, not only these extremes.
WHAT THE POST SAYS
Content types
This account uses insufficient context in 100% of its X posts. The table covers the whole content mix, including sparse categories.
Category / all posts
Top 1
Bottom 1
Adjusted response vs other posts
Insufficient context2 of 2 posts · 100%
1
1
Not enough comparable postsFewer than 5 posts on either side in overlapping months, or no usable variation.
HOW IT IS PRESENTED
Creative formats
This account uses text-led or link post in 100% of its X posts. The table covers the whole content mix, including sparse categories.
Not enough comparable postsFewer than 5 posts on either side in overlapping months, or no usable variation.
1× means similar response to this company’s other content on this platform, after accounting for month. The interval shows uncertainty; a result spanning 1× does not establish an advantage. Types and formats are analyzed separately, so this is association rather than an isolated causal effect.
Ranked by likes, comments and shares relative to the same company’s typical post on the same platform that month. 1× is usual; 5× is five times usual. The score uses +1 to handle zero counts. These are examples, not the statistical test.
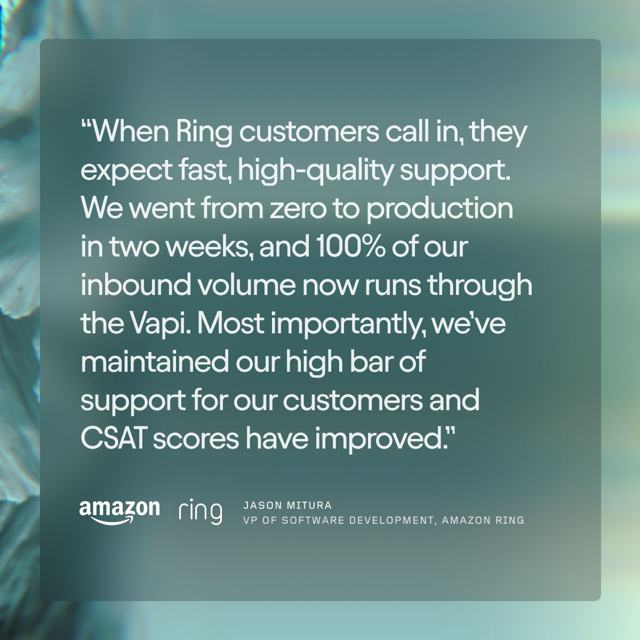
Vapi provides APIs and infrastructure for production voice agents. Developers connect models, speech services, tools and telephony to automate business conversations and telephone workflows. Company site ↗
Who it sells to: Engineering teams and businesses deploying voice-based AI applications.
All 213 posts are counted below. Top 10 and bottom 10 use equal group sizes and rank public responses relative to this company’s month. The adjusted estimate uses all comparable posts, not only these extremes.
WHAT THE POST SAYS
Content types
This account uses events and community in 40% of its LinkedIn posts. The highest category estimate is company news and milestones (3.0×); the lowest is people, careers, and company culture (0.4×). These are directional estimates; the intervals below show how uncertain their size is. The table covers the whole content mix, including sparse categories.
Not enough comparable postsFewer than 5 posts on either side in overlapping months, or no usable variation.
Insufficient context1 of 213 posts · 0%
0
0
Not enough comparable postsFewer than 5 posts on either side in overlapping months, or no usable variation.
HOW IT IS PRESENTED
Creative formats
This account uses text-led or link post in 30% of its LinkedIn posts. The highest category estimate is presenter explanation (2.6×); the lowest is text-led or link post (0.4×). These are directional estimates; the intervals below show how uncertain their size is. The table covers the whole content mix, including sparse categories.
Media across all 213 posts
Still image · 94 (44%)Text / link · 89 (42%)Video · 25 (12%)Document / slides · 5 (2%)
Not enough comparable postsFewer than 5 posts on either side in overlapping months, or no usable variation.
1× means similar response to this company’s other content on this platform, after accounting for month. The interval shows uncertainty; a result spanning 1× does not establish an advantage. Types and formats are analyzed separately, so this is association rather than an isolated causal effect.
Ranked by likes, comments and shares relative to the same company’s typical post on the same platform that month. 1× is usual; 5× is five times usual. The score uses +1 to handle zero counts. These are examples, not the statistical test.
Vapi provides APIs and infrastructure for production voice agents. Developers connect models, speech services, tools and telephony to automate business conversations and telephone workflows. Company site ↗
Who it sells to: Engineering teams and businesses deploying voice-based AI applications.
All 121 posts are counted below. Top 10 and bottom 10 use equal group sizes and rank public responses relative to this company’s month. The adjusted estimate uses all comparable posts, not only these extremes.
WHAT THE POST SAYS
Content types
This account uses events and community in 56% of its X posts. The highest category estimate is benchmarks and original data (4.4×); the lowest is events and community (0.5×). These are directional estimates; the intervals below show how uncertain their size is. The table covers the whole content mix, including sparse categories.
Not enough comparable postsFewer than 5 posts on either side in overlapping months, or no usable variation.
HOW IT IS PRESENTED
Creative formats
This account uses announcement card in 32% of its X posts. The highest category estimate is presenter explanation (2.0×); the lowest is expert or founder interview (0.6×). These are directional estimates; the intervals below show how uncertain their size is. The table covers the whole content mix, including sparse categories.
Media across all 121 posts
Still image · 61 (50%)Text / link · 37 (31%)Video · 19 (16%)GIF · 4 (3%)
Not enough comparable postsFewer than 5 posts on either side in overlapping months, or no usable variation.
1× means similar response to this company’s other content on this platform, after accounting for month. The interval shows uncertainty; a result spanning 1× does not establish an advantage. Types and formats are analyzed separately, so this is association rather than an isolated causal effect.
Ranked by likes, comments and shares relative to the same company’s typical post on the same platform that month. 1× is usual; 5× is five times usual. The score uses +1 to handle zero counts. These are examples, not the statistical test.
Parallel Web Systems provides search, extraction, monitoring and research APIs for AI applications. Its services help agents gather and reason over information from the live web. Company site ↗
Who it sells to: AI developers and enterprise teams building research and web-information workflows.
All 93 posts are counted below. Top 10 and bottom 10 use equal group sizes and rank public responses relative to this company’s month. The adjusted estimate uses all comparable posts, not only these extremes.
WHAT THE POST SAYS
Content types
This account uses product benefits and capabilities in 38% of its LinkedIn posts. The highest category estimate is company news and milestones (1.3×); the lowest is benchmarks and original data (0.5×). These are directional estimates; the intervals below show how uncertain their size is. The table covers the whole content mix, including sparse categories.
Not enough comparable postsFewer than 5 posts on either side in overlapping months, or no usable variation.
HOW IT IS PRESENTED
Creative formats
This account uses article or video cover card in 26% of its LinkedIn posts. The highest category estimate is people or event footage (1.7×); the lowest is chart or data table (0.6×). These are directional estimates; the intervals below show how uncertain their size is. The table covers the whole content mix, including sparse categories.
Media across all 93 posts
Still image · 59 (63%)Video · 26 (28%)Text / link · 7 (8%)Document / slides · 1 (1%)
Not enough comparable postsFewer than 5 posts on either side in overlapping months, or no usable variation.
1× means similar response to this company’s other content on this platform, after accounting for month. The interval shows uncertainty; a result spanning 1× does not establish an advantage. Types and formats are analyzed separately, so this is association rather than an isolated causal effect.
Ranked by likes, comments and shares relative to the same company’s typical post on the same platform that month. 1× is usual; 5× is five times usual. The score uses +1 to handle zero counts. These are examples, not the statistical test.
Parallel Web Systems provides search, extraction, monitoring and research APIs for AI applications. Its services help agents gather and reason over information from the live web. Company site ↗
Who it sells to: AI developers and enterprise teams building research and web-information workflows.
All 113 posts are counted below. Top 10 and bottom 10 use equal group sizes and rank public responses relative to this company’s month. The adjusted estimate uses all comparable posts, not only these extremes.
WHAT THE POST SAYS
Content types
This account uses product benefits and capabilities in 33% of its X posts. The highest category estimate is benchmarks and original data (2.8×); the lowest is events and community (0.5×). These are directional estimates; the intervals below show how uncertain their size is. The table covers the whole content mix, including sparse categories.
Not enough comparable postsFewer than 5 posts on either side in overlapping months, or no usable variation.
HOW IT IS PRESENTED
Creative formats
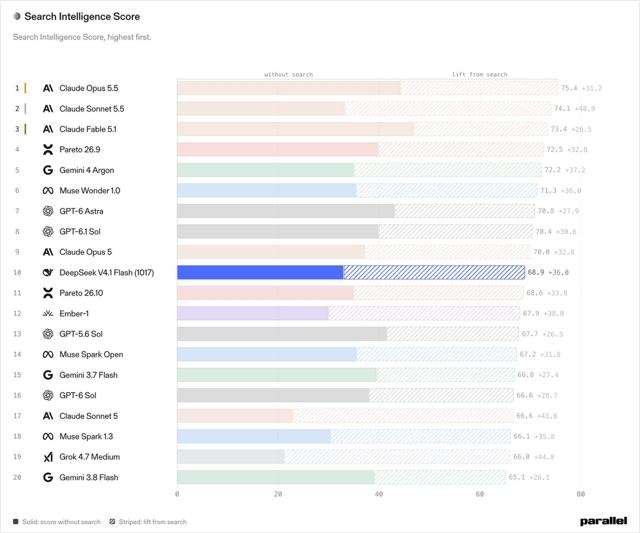
This account uses text-led or link post in 30% of its X posts. The highest category estimate is chart or data table (2.4×); the lowest is customer quote card (0.4×). These are directional estimates; the intervals below show how uncertain their size is. The table covers the whole content mix, including sparse categories.
Media across all 113 posts
Still image · 49 (43%)Text / link · 34 (30%)Video · 22 (19%)GIF · 8 (7%)
Not enough comparable postsFewer than 5 posts on either side in overlapping months, or no usable variation.
1× means similar response to this company’s other content on this platform, after accounting for month. The interval shows uncertainty; a result spanning 1× does not establish an advantage. Types and formats are analyzed separately, so this is association rather than an isolated causal effect.
Ranked by likes, comments and shares relative to the same company’s typical post on the same platform that month. 1× is usual; 5× is five times usual. The score uses +1 to handle zero counts. These are examples, not the statistical test.
Clerk provides authentication and user-management infrastructure for software applications. Developers use its interfaces, APIs and dashboards to manage users, organizations, sign-in and agent access. Company site ↗
Who it sells to: Developers and software companies adding authentication and serving business customers.
All 11 posts are counted below. Top 2 and bottom 2 use equal group sizes and rank public responses relative to this company’s month. The adjusted estimate uses all comparable posts, not only these extremes.
WHAT THE POST SAYS
Content types
This account uses product benefits and capabilities in 91% of its LinkedIn posts. The table covers the whole content mix, including sparse categories.
Not enough comparable postsFewer than 5 posts on either side in overlapping months, or no usable variation.
1× means similar response to this company’s other content on this platform, after accounting for month. The interval shows uncertainty; a result spanning 1× does not establish an advantage. Types and formats are analyzed separately, so this is association rather than an isolated causal effect.
Ranked by likes, comments and shares relative to the same company’s typical post on the same platform that month. 1× is usual; 5× is five times usual. The score uses +1 to handle zero counts. These are examples, not the statistical test.
Clerk provides authentication and user-management infrastructure for software applications. Developers use its interfaces, APIs and dashboards to manage users, organizations, sign-in and agent access. Company site ↗
Who it sells to: Developers and software companies adding authentication and serving business customers.
All 39 posts are counted below. Top 9 and bottom 9 use equal group sizes and rank public responses relative to this company’s month. The adjusted estimate uses all comparable posts, not only these extremes.
WHAT THE POST SAYS
Content types
This account uses product benefits and capabilities in 72% of its X posts. Only product benefits and capabilities has enough comparable repeated posts for an estimate: 1.6× versus its other content. These are directional estimates; the intervals below show how uncertain their size is. The table covers the whole content mix, including sparse categories.
Not enough comparable postsFewer than 5 posts on either side in overlapping months, or no usable variation.
Insufficient context1 of 39 posts · 3%
0
0
Not enough comparable postsFewer than 5 posts on either side in overlapping months, or no usable variation.
HOW IT IS PRESENTED
Creative formats
This account uses text-led or link post in 44% of its X posts. The highest category estimate is product demo or ui (1.9×); the lowest is text-led or link post (0.5×). These are directional estimates; the intervals below show how uncertain their size is. The table covers the whole content mix, including sparse categories.
Media across all 39 posts
Video · 20 (51%)Text / link · 17 (44%)GIF · 1 (3%)Still image · 1 (3%)
Not enough comparable postsFewer than 5 posts on either side in overlapping months, or no usable variation.
1× means similar response to this company’s other content on this platform, after accounting for month. The interval shows uncertainty; a result spanning 1× does not establish an advantage. Types and formats are analyzed separately, so this is association rather than an isolated causal effect.
Ranked by likes, comments and shares relative to the same company’s typical post on the same platform that month. 1× is usual; 5× is five times usual. The score uses +1 to handle zero counts. These are examples, not the statistical test.
MotherDuck provides cloud analytics built around DuckDB. Data teams, application developers and AI agents use SQL to query and analyze information across cloud and local environments. Company site ↗
Who it sells to: Data and engineering teams building analytics applications and answering business questions.
All 269 posts are counted below. Top 10 and bottom 10 use equal group sizes and rank public responses relative to this company’s month. The adjusted estimate uses all comparable posts, not only these extremes.
WHAT THE POST SAYS
Content types
This account uses events and community in 32% of its LinkedIn posts. The highest category estimate is brand stories and entertainment (2.9×); the lowest is tutorials and practical education (0.6×). These are directional estimates; the intervals below show how uncertain their size is. The table covers the whole content mix, including sparse categories.
Not enough comparable postsFewer than 5 posts on either side in overlapping months, or no usable variation.
HOW IT IS PRESENTED
Creative formats
This account uses article or video cover card in 53% of its LinkedIn posts. The highest category estimate is illustration or meme (1.7×); the lowest is recorded technical talk (0.5×). These are directional estimates; the intervals below show how uncertain their size is. The table covers the whole content mix, including sparse categories.
Media across all 269 posts
Still image · 144 (54%)Text / link · 68 (25%)Video · 55 (20%)Document / slides · 2 (1%)
Not enough comparable postsFewer than 5 posts on either side in overlapping months, or no usable variation.
1× means similar response to this company’s other content on this platform, after accounting for month. The interval shows uncertainty; a result spanning 1× does not establish an advantage. Types and formats are analyzed separately, so this is association rather than an isolated causal effect.
Ranked by likes, comments and shares relative to the same company’s typical post on the same platform that month. 1× is usual; 5× is five times usual. The score uses +1 to handle zero counts. These are examples, not the statistical test.
MotherDuck provides cloud analytics built around DuckDB. Data teams, application developers and AI agents use SQL to query and analyze information across cloud and local environments. Company site ↗
Who it sells to: Data and engineering teams building analytics applications and answering business questions.
All 205 posts are counted below. Top 10 and bottom 10 use equal group sizes and rank public responses relative to this company’s month. The adjusted estimate uses all comparable posts, not only these extremes.
WHAT THE POST SAYS
Content types
This account uses events and community in 31% of its X posts. The highest category estimate is company news and milestones (2.1×); the lowest is events and community (0.5×). These are directional estimates; the intervals below show how uncertain their size is. The table covers the whole content mix, including sparse categories.
Not enough comparable postsFewer than 5 posts on either side in overlapping months, or no usable variation.
HOW IT IS PRESENTED
Creative formats
This account uses text-led or link post in 49% of its X posts. The highest category estimate is product demo or ui (2.9×); the lowest is text-led or link post (0.8×). These are directional estimates; the intervals below show how uncertain their size is. The table covers the whole content mix, including sparse categories.
Media across all 205 posts
Text / link · 100 (49%)Still image · 76 (37%)Video · 24 (12%)GIF · 5 (2%)
Not enough comparable postsFewer than 5 posts on either side in overlapping months, or no usable variation.
Unclear from available creative1 of 205 posts · 0%
0
0
Not enough comparable postsFewer than 5 posts on either side in overlapping months, or no usable variation.
1× means similar response to this company’s other content on this platform, after accounting for month. The interval shows uncertainty; a result spanning 1× does not establish an advantage. Types and formats are analyzed separately, so this is association rather than an isolated causal effect.
Ranked by likes, comments and shares relative to the same company’s typical post on the same platform that month. 1× is usual; 5× is five times usual. The score uses +1 to handle zero counts. These are examples, not the statistical test.
Doppler helps engineering teams manage secrets and software credentials across applications, environments and cloud infrastructure. Its platform centralizes access and distribution of sensitive configuration used by software and AI agents. Company site ↗
Who it sells to: Developers, platform engineers and security teams responsible for software credentials.
All 67 posts are counted below. Top 10 and bottom 10 use equal group sizes and rank public responses relative to this company’s month. The adjusted estimate uses all comparable posts, not only these extremes.
WHAT THE POST SAYS
Content types
This account uses product benefits and capabilities in 25% of its LinkedIn posts. The highest category estimate is people, careers, and company culture (2.7×); the lowest is tutorials and practical education (0.6×). These are directional estimates; the intervals below show how uncertain their size is. The table covers the whole content mix, including sparse categories.
Not enough comparable postsFewer than 5 posts on either side in overlapping months, or no usable variation.
HOW IT IS PRESENTED
Creative formats
This account uses article or video cover card in 40% of its LinkedIn posts. The highest category estimate is announcement card (3.4×); the lowest is article or video cover card (0.5×). These are directional estimates; the intervals below show how uncertain their size is. The table covers the whole content mix, including sparse categories.
Media across all 67 posts
Still image · 39 (58%)Text / link · 16 (24%)Video · 12 (18%)
Not enough comparable postsFewer than 5 posts on either side in overlapping months, or no usable variation.
1× means similar response to this company’s other content on this platform, after accounting for month. The interval shows uncertainty; a result spanning 1× does not establish an advantage. Types and formats are analyzed separately, so this is association rather than an isolated causal effect.
Ranked by likes, comments and shares relative to the same company’s typical post on the same platform that month. 1× is usual; 5× is five times usual. The score uses +1 to handle zero counts. These are examples, not the statistical test.
Doppler helps engineering teams manage secrets and software credentials across applications, environments and cloud infrastructure. Its platform centralizes access and distribution of sensitive configuration used by software and AI agents. Company site ↗
Who it sells to: Developers, platform engineers and security teams responsible for software credentials.
The verified timeline returned no company-owned posts that meet the date, age and public-count requirements. This channel contributes no performance observations.
ngrok provides a cloud gateway for exposing, securing and routing application and API traffic. Developers and platform teams use it to connect services across local development, production and AI systems. Company site ↗
Who it sells to: Developers and platform teams operating APIs, applications and AI services.
All 18 posts are counted below. Top 4 and bottom 4 use equal group sizes and rank public responses relative to this company’s month. The adjusted estimate uses all comparable posts, not only these extremes.
WHAT THE POST SAYS
Content types
This account uses product benefits and capabilities in 39% of its LinkedIn posts. Only product benefits and capabilities has enough comparable repeated posts for an estimate: 1.1× versus its other content. These are directional estimates; the intervals below show how uncertain their size is. The table covers the whole content mix, including sparse categories.
Not enough comparable postsFewer than 5 posts on either side in overlapping months, or no usable variation.
HOW IT IS PRESENTED
Creative formats
This account uses article or video cover card in 67% of its LinkedIn posts. Only article or video cover card has enough comparable repeated posts for an estimate: 1.2× versus its other content. These are directional estimates; the intervals below show how uncertain their size is. The table covers the whole content mix, including sparse categories.
Media across all 18 posts
Text / link · 10 (56%)Video · 7 (39%)Still image · 1 (6%)
Not enough comparable postsFewer than 5 posts on either side in overlapping months, or no usable variation.
1× means similar response to this company’s other content on this platform, after accounting for month. The interval shows uncertainty; a result spanning 1× does not establish an advantage. Types and formats are analyzed separately, so this is association rather than an isolated causal effect.
Ranked by likes, comments and shares relative to the same company’s typical post on the same platform that month. 1× is usual; 5× is five times usual. The score uses +1 to handle zero counts. These are examples, not the statistical test.
ngrok provides a cloud gateway for exposing, securing and routing application and API traffic. Developers and platform teams use it to connect services across local development, production and AI systems. Company site ↗
Who it sells to: Developers and platform teams operating APIs, applications and AI services.
All 64 posts are counted below. Top 10 and bottom 10 use equal group sizes and rank public responses relative to this company’s month. The adjusted estimate uses all comparable posts, not only these extremes.
WHAT THE POST SAYS
Content types
This account uses product benefits and capabilities in 34% of its X posts. The highest category estimate is engineering and operating lessons (1.9×); the lowest is product benefits and capabilities (0.9×). These are directional estimates; the intervals below show how uncertain their size is. The table covers the whole content mix, including sparse categories.
Not enough comparable postsFewer than 5 posts on either side in overlapping months, or no usable variation.
HOW IT IS PRESENTED
Creative formats
This account uses text-led or link post in 61% of its X posts. The highest category estimate is presenter explanation (1.5×); the lowest is text-led or link post (0.7×). These are directional estimates; the intervals below show how uncertain their size is. The table covers the whole content mix, including sparse categories.
Media across all 64 posts
Text / link · 39 (61%)Still image · 14 (22%)Video · 10 (16%)GIF · 1 (2%)
Not enough comparable postsFewer than 5 posts on either side in overlapping months, or no usable variation.
1× means similar response to this company’s other content on this platform, after accounting for month. The interval shows uncertainty; a result spanning 1× does not establish an advantage. Types and formats are analyzed separately, so this is association rather than an isolated causal effect.
Ranked by likes, comments and shares relative to the same company’s typical post on the same platform that month. 1× is usual; 5× is five times usual. The score uses +1 to handle zero counts. These are examples, not the statistical test.
What companies talk about: product benefits, customer stories, research, tutorials, and other topics.
Benchmarks and original data
8 of 10 company estimates are higher. Median company estimate: 1.19×. Range: Firecrawl 0.85× to Composio 9.8×. Direction is informative; the overall size remains uncertain.
Events and community
2 of 16 company estimates are higher. Median company estimate: 0.78×. Range: Convex 0.45× to Doppler 1.43×. The combined result has stronger statistical support.
People, careers, and company culture
2 of 6 company estimates are higher. Median company estimate: 0.93×. Range: Vapi 0.39× to WorkOS 3.2×. Direction is informative; the overall size remains uncertain.
Read the direction and consistency, not just a significance verdict. Each company is compared with its own other content on the same platform and in overlapping months, then the results are combined across companies. Ranked by estimated relative public response, with uncertainty shown. The company estimates show where the direction repeats or changes. Where platforms differ materially, the row shows separate estimates for the same companies. Open “Uncertainty” for statistical limits; a directional pattern is not a proven winner. Use the direct comparison below to inspect a specific pair.
95% interval: 0.92×–2.8×. The data does not establish a reliable average advantage or disadvantage. The direction across companies and the examples are still informative.
Higher estimates across most comparable companies.
8 of 10 company estimates are above baseline; 2 are below. The median company estimate is 1.19×. Higher end: Composio 9.8×, Vapi 4.4×. Lower end: Firecrawl 0.85×, turbopuffer 0.97×. The average effect remains uncertain.
95% interval: 0.59×–4.0×. The data does not establish a reliable average advantage or disadvantage. The direction across companies and the examples are still informative.
Higher estimates across most comparable companies.
3 of 3 company estimates are above baseline; 0 are below. The median company estimate is 1.59×. Higher end: Firecrawl 2.2×, Braintrust 1.59×. Lower end: MotherDuck 1.45×, Braintrust 1.59×. The average effect remains uncertain.
95% interval: 0.80×–2.6×. The data does not establish a reliable average advantage or disadvantage. The direction across companies and the examples are still informative.
Higher estimates across most comparable companies.
7 of 9 company estimates are above baseline; 2 are below. The median company estimate is 1.61×. Higher end: Vapi 3.0×, Arcade.dev 3.0×. Lower end: Composio 0.41×, Firecrawl 0.83×. The average effect remains uncertain. Funding, acquisitions and major milestones are episodic; the same attention spike may not be available as a regular publishing pattern.
95% interval: 0.66×–1.95×. The data does not establish a reliable average advantage or disadvantage. The direction across companies and the examples are still informative.
3 of 5 company estimates are above baseline; 2 are below. The median company estimate is 1.06×. Higher end: MotherDuck 1.81×, Convex 1.20×. Lower end: Parallel 0.82×, Composio 0.96×. The average effect remains uncertain.
95% interval: 0.95×–1.32×. The data does not establish a reliable average advantage or disadvantage. The direction across companies and the examples are still informative.
Higher estimates across most comparable companies.
16 of 21 company estimates are above baseline; 5 are below. The median company estimate is 1.23×. Higher end: Vapi 1.90×, Fiddler AI 1.89×. Lower end: Trigger.dev 0.57×, turbopuffer 0.58×. The average effect remains uncertain.
95% interval: 0.91×–1.37×. The data does not establish a reliable average advantage or disadvantage. The direction across companies and the examples are still informative.
Higher estimates across most comparable companies.
7 of 9 company estimates are above baseline; 2 are below. The median company estimate is 1.14×. Higher end: ngrok 1.92×, turbopuffer 1.70×. Lower end: Browserbase 0.83×, Arcade.dev 0.94×. The average effect remains uncertain.
95% interval: 0.44×–2.7×. The data does not establish a reliable average advantage or disadvantage. The direction across companies and the examples are still informative.
2 of 6 company estimates are above baseline; 4 are below. The median company estimate is 0.93×. Higher end: WorkOS 3.2×, Doppler 2.7×. Lower end: Vapi 0.39×, Patronus AI 0.82×. The average effect remains uncertain.
95% interval: 0.80×–1.19×. The data does not establish a reliable average advantage or disadvantage. The direction across companies and the examples are still informative.
4 of 11 company estimates are above baseline; 7 are below. The median company estimate is 0.94×. Higher end: turbopuffer 1.56×, Braintrust 1.37×. Lower end: Fiddler AI 0.64×, Composio 0.74×. The average effect remains uncertain.
95% interval: 0.78×–1.05×. The data does not establish a reliable average advantage or disadvantage. The direction across companies and the examples are still informative.
3 of 12 company estimates are above baseline; 9 are below. The median company estimate is 0.85×. Higher end: CrewAI 1.32×, Composio 1.12×. Lower end: Doppler 0.68×, Fiddler AI 0.70×. The average effect remains uncertain.
2 of 16 company estimates are above baseline; 14 are below. The median company estimate is 0.78×. Higher end: Doppler 1.43×, Braintrust 1.05×. Lower end: Convex 0.45×, LlamaIndex 0.51×. The combined average also has stronger statistical support.
95% interval: 0.56×–0.94×. The data does not establish a reliable average advantage or disadvantage. The direction across companies and the examples are still informative.
1 of 6 company estimates are above baseline; 5 are below. The median company estimate is 0.75×. Higher end: Vapi 1.11×, ngrok 0.99×. Lower end: Braintrust 0.60×, Doppler 0.62×. The average effect remains uncertain.
Unknown classifications remain in the inventory, but are excluded from category-effect models. Text-led/link records identify posts without returned root media; an unreturned published link preview may still have been present. Broad conclusions require at least three comparable companies. Directional readouts describe the saved estimates, not statistically proven rules. Formal uncertainty accounts for multiple category comparisons. Each company chip averages its available platform log effects equally; the combined estimate also accounts for precision and between-company variation.
Compare two content types
Uses only the same companies, platforms and months where both categories were posted.
Tests, comparisons, surveys, or measurements that give the audience new information.
Performance relative to each company’s other content
Higher estimates across most comparable companies.
8 of 10 company estimates are above baseline; 2 are below. The median company estimate is 1.19×. Higher end: Composio 9.8×, Vapi 4.4×. Lower end: Firecrawl 0.85×, turbopuffer 0.97×. The average effect remains uncertain.
1.60×
Estimated combined response vs other content
10 comparable companies · 224 category posts in the model
95% interval: 0.92×–2.8×. The data does not establish a reliable average advantage or disadvantage. The direction across companies and the examples are still informative.
LinkedIn and X separately
No clear material platform difference was established; this does not prove the results are identical.
LinkedIn0.99×95% interval 0.74×–1.32×Estimate close to baselineDirection or size remains uncertain6 companies
X views: a separate measure of reach1.72×95% interval 0.95×–3.1×Estimate: 72% higherDirection or size remains uncertain
10 comparable companies. Views are analyzed separately from public responses.
Company-by-company comparison
Same company, same platform, with month accounted for. Missing estimates mean too few overlapping posts or too little category variation; they do not mean poor performance.
One ranking across companies, based on each post’s response relative to its own company and month.
Ranked by likes, comments and shares relative to the same company’s typical post on the same platform that month. 1× is usual; 5× is five times usual. The score uses +1 to handle zero counts. These are examples, not the statistical test.
A real organization or user explains a workflow, implementation, or result.
Performance relative to each company’s other content
Performance varies across companies.
4 of 11 company estimates are above baseline; 7 are below. The median company estimate is 0.94×. Higher end: turbopuffer 1.56×, Braintrust 1.37×. Lower end: Fiddler AI 0.64×, Composio 0.74×. The average effect remains uncertain.
0.98×
Estimated combined response vs other content
11 comparable companies · 152 category posts in the model
95% interval: 0.80×–1.19×. The data does not establish a reliable average advantage or disadvantage. The direction across companies and the examples are still informative.
LinkedIn and X separately
No clear material platform difference was established; this does not prove the results are identical.
LinkedIn1.13×95% interval 0.87×–1.46×Estimate: 13% higherDirection or size remains uncertain10 companies
X0.84×95% interval 0.67×–1.06×Estimate: 16% lowerDirection or size remains uncertain7 companies
X views: a separate measure of reach0.78×95% interval 0.62×–0.98×Estimate: 22% lowerDirection or size remains uncertain
7 comparable companies. Views are analyzed separately from public responses.
Company-by-company comparison
Same company, same platform, with month accounted for. Missing estimates mean too few overlapping posts or too little category variation; they do not mean poor performance.
One ranking across companies, based on each post’s response relative to its own company and month.
Ranked by likes, comments and shares relative to the same company’s typical post on the same platform that month. 1× is usual; 5× is five times usual. The score uses +1 to handle zero counts. These are examples, not the statistical test.
What the software lets someone do, which problem it solves, or which effort or cost it removes.
Performance relative to each company’s other content
Higher estimates across most comparable companies.
16 of 21 company estimates are above baseline; 5 are below. The median company estimate is 1.23×. Higher end: Vapi 1.90×, Fiddler AI 1.89×. Lower end: Trigger.dev 0.57×, turbopuffer 0.58×. The average effect remains uncertain.
1.12×
Estimated combined response vs other content
21 comparable companies · 1066 category posts in the model
95% interval: 0.95×–1.32×. The data does not establish a reliable average advantage or disadvantage. The direction across companies and the examples are still informative.
LinkedIn and X separately
No clear material platform difference was established; this does not prove the results are identical.
LinkedIn1.06×95% interval 0.91×–1.23×Estimate: 6% higherDirection or size remains uncertain20 companies
X1.22×95% interval 0.99×–1.51×Estimate: 22% higherDirection or size remains uncertain19 companies
X views: a separate measure of reach1.19×95% interval 0.96×–1.47×Estimate: 19% higherDirection or size remains uncertain
19 comparable companies. Views are analyzed separately from public responses.
Company-by-company comparison
Same company, same platform, with month accounted for. Missing estimates mean too few overlapping posts or too little category variation; they do not mean poor performance.
One ranking across companies, based on each post’s response relative to its own company and month.
Ranked by likes, comments and shares relative to the same company’s typical post on the same platform that month. 1× is usual; 5× is five times usual. The score uses +1 to handle zero counts. These are examples, not the statistical test.
An explanation, demonstration, or guide that helps someone perform a task.
Performance relative to each company’s other content
Lower estimates across most comparable companies.
1 of 6 company estimates are above baseline; 5 are below. The median company estimate is 0.75×. Higher end: Vapi 1.11×, ngrok 0.99×. Lower end: Braintrust 0.60×, Doppler 0.62×. The average effect remains uncertain.
0.73×
Estimated combined response vs other content
6 comparable companies · 112 category posts in the model
95% interval: 0.56×–0.94×. The data does not establish a reliable average advantage or disadvantage. The direction across companies and the examples are still informative.
LinkedIn and X separately
No clear material platform difference was established; this does not prove the results are identical.
LinkedIn0.74×95% interval 0.57×–0.95×Estimate: 26% lowerDirection or size remains uncertain5 companies
X0.76×95% interval 0.49×–1.19×Estimate: 24% lowerDirection or size remains uncertain5 companies
X views: a separate measure of reach0.74×95% interval 0.38×–1.44×Estimate: 26% lowerDirection or size remains uncertain
5 comparable companies. Views are analyzed separately from public responses.
Company-by-company comparison
Same company, same platform, with month accounted for. Missing estimates mean too few overlapping posts or too little category variation; they do not mean poor performance.
One ranking across companies, based on each post’s response relative to its own company and month.
Ranked by likes, comments and shares relative to the same company’s typical post on the same platform that month. 1× is usual; 5× is five times usual. The score uses +1 to handle zero counts. These are examples, not the statistical test.
How a system was built or operated, and the decisions, constraints, or tradeoffs involved.
Performance relative to each company’s other content
Higher estimates across most comparable companies.
7 of 9 company estimates are above baseline; 2 are below. The median company estimate is 1.14×. Higher end: ngrok 1.92×, turbopuffer 1.70×. Lower end: Browserbase 0.83×, Arcade.dev 0.94×. The average effect remains uncertain.
1.12×
Estimated combined response vs other content
9 comparable companies · 156 category posts in the model
95% interval: 0.91×–1.37×. The data does not establish a reliable average advantage or disadvantage. The direction across companies and the examples are still informative.
LinkedIn and X separately
No clear material platform difference was established; this does not prove the results are identical.
LinkedIn1.15×95% interval 0.90×–1.46×Estimate: 15% higherDirection or size remains uncertain8 companies
X1.13×95% interval 0.82×–1.58×Estimate: 13% higherDirection or size remains uncertain9 companies
X views: a separate measure of reach1.12×95% interval 0.76×–1.63×Estimate: 12% higherDirection or size remains uncertain
9 comparable companies. Views are analyzed separately from public responses.
Company-by-company comparison
Same company, same platform, with month accounted for. Missing estimates mean too few overlapping posts or too little category variation; they do not mean poor performance.
One ranking across companies, based on each post’s response relative to its own company and month.
Ranked by likes, comments and shares relative to the same company’s typical post on the same platform that month. 1× is usual; 5× is five times usual. The score uses +1 to handle zero counts. These are examples, not the statistical test.
Useful perspectives on the audience’s field, even when the post does not directly sell the product.
Performance relative to each company’s other content
Lower estimates across most comparable companies.
3 of 12 company estimates are above baseline; 9 are below. The median company estimate is 0.85×. Higher end: CrewAI 1.32×, Composio 1.12×. Lower end: Doppler 0.68×, Fiddler AI 0.70×. The average effect remains uncertain.
0.91×
Estimated combined response vs other content
12 comparable companies · 327 category posts in the model
95% interval: 0.78×–1.05×. The data does not establish a reliable average advantage or disadvantage. The direction across companies and the examples are still informative.
LinkedIn and X separately
No clear material platform difference was established; this does not prove the results are identical.
LinkedIn0.94×95% interval 0.78×–1.13×Estimate: 6% lowerDirection or size remains uncertain10 companies
X views: a separate measure of reach0.75×95% interval 0.60×–0.94×Estimate: 25% lowerStronger statistical support
9 comparable companies. Views are analyzed separately from public responses.
Company-by-company comparison
Same company, same platform, with month accounted for. Missing estimates mean too few overlapping posts or too little category variation; they do not mean poor performance.
One ranking across companies, based on each post’s response relative to its own company and month.
Ranked by likes, comments and shares relative to the same company’s typical post on the same platform that month. 1× is usual; 5× is five times usual. The score uses +1 to handle zero counts. These are examples, not the statistical test.
A reusable library, template, catalog, dataset, game, or other artifact people can use.
Performance relative to each company’s other content
Higher estimates across most comparable companies.
3 of 3 company estimates are above baseline; 0 are below. The median company estimate is 1.59×. Higher end: Firecrawl 2.2×, Braintrust 1.59×. Lower end: MotherDuck 1.45×, Braintrust 1.59×. The average effect remains uncertain.
1.52×
Estimated combined response vs other content
3 comparable companies · 30 category posts in the model
95% interval: 0.59×–4.0×. The data does not establish a reliable average advantage or disadvantage. The direction across companies and the examples are still informative.
LinkedIn and X separately
No clear material platform difference was established; this does not prove the results are identical.
LinkedIn1.31×95% interval 0.61×–2.8×Estimate: 31% higherDirection or size remains uncertain3 companies
X1.77×95% interval 0.09×–35.3×Estimate: 77% higherDirection or size remains uncertain2 companies
X views: a separate measure of reach2.2×95% interval <0.01×–8615.2×Estimate: 117% higherDirection or size remains uncertain
2 comparable companies. Views are analyzed separately from public responses.
Company-by-company comparison
Same company, same platform, with month accounted for. Missing estimates mean too few overlapping posts or too little category variation; they do not mean poor performance.
One ranking across companies, based on each post’s response relative to its own company and month.
Ranked by likes, comments and shares relative to the same company’s typical post on the same platform that month. 1× is usual; 5× is five times usual. The score uses +1 to handle zero counts. These are examples, not the statistical test.
Invitations, speaker announcements, webinars, conference recaps, or community gatherings.
Performance relative to each company’s other content
Lower estimates across most comparable companies.
2 of 16 company estimates are above baseline; 14 are below. The median company estimate is 0.78×. Higher end: Doppler 1.43×, Braintrust 1.05×. Lower end: Convex 0.45×, LlamaIndex 0.51×. The combined average also has stronger statistical support.
0.80×
Estimated combined response vs other content
16 comparable companies · 1075 category posts in the model
X views: a separate measure of reach0.60×95% interval 0.46×–0.77×Estimate: 40% lowerStronger statistical support
13 comparable companies. Views are analyzed separately from public responses.
Company-by-company comparison
Same company, same platform, with month accounted for. Missing estimates mean too few overlapping posts or too little category variation; they do not mean poor performance.
One ranking across companies, based on each post’s response relative to its own company and month.
Ranked by likes, comments and shares relative to the same company’s typical post on the same platform that month. 1× is usual; 5× is five times usual. The score uses +1 to handle zero counts. These are examples, not the statistical test.
Employee welcomes, recruiting, founder stories, career experiences, and what the team is like.
Performance relative to each company’s other content
Performance varies across companies.
2 of 6 company estimates are above baseline; 4 are below. The median company estimate is 0.93×. Higher end: WorkOS 3.2×, Doppler 2.7×. Lower end: Vapi 0.39×, Patronus AI 0.82×. The average effect remains uncertain.
1.09×
Estimated combined response vs other content
6 comparable companies · 123 category posts in the model
95% interval: 0.44×–2.7×. The data does not establish a reliable average advantage or disadvantage. The direction across companies and the examples are still informative.
LinkedIn and X separately
No clear material platform difference was established; this does not prove the results are identical.
LinkedIn1.05×95% interval 0.45×–2.5×Estimate: 5% higherDirection or size remains uncertain6 companies
X0.96×95% interval 0.04×–20.9×Estimate close to baselineDirection or size remains uncertain2 companies
X views: a separate measure of reach0.84×95% interval 0.03×–24.6×Estimate: 16% lowerDirection or size remains uncertain
2 comparable companies. Views are analyzed separately from public responses.
Company-by-company comparison
Same company, same platform, with month accounted for. Missing estimates mean too few overlapping posts or too little category variation; they do not mean poor performance.
One ranking across companies, based on each post’s response relative to its own company and month.
Ranked by likes, comments and shares relative to the same company’s typical post on the same platform that month. 1× is usual; 5× is five times usual. The score uses +1 to handle zero counts. These are examples, not the statistical test.
Funding, adoption milestones, major corporate announcements, or incident communication.
Performance relative to each company’s other content
Higher estimates across most comparable companies.
7 of 9 company estimates are above baseline; 2 are below. The median company estimate is 1.61×. Higher end: Vapi 3.0×, Arcade.dev 3.0×. Lower end: Composio 0.41×, Firecrawl 0.83×. The average effect remains uncertain. Funding, acquisitions and major milestones are episodic; the same attention spike may not be available as a regular publishing pattern.
1.43×
Estimated combined response vs other content
9 comparable companies · 102 category posts in the model
95% interval: 0.80×–2.6×. The data does not establish a reliable average advantage or disadvantage. The direction across companies and the examples are still informative.
LinkedIn and X separately
No clear material platform difference was established; this does not prove the results are identical.
X1.10×95% interval 0.58×–2.1×Estimate: 10% higherDirection or size remains uncertain8 companies
X views: a separate measure of reach1.16×95% interval 0.58×–2.3×Estimate: 16% higherDirection or size remains uncertain
8 comparable companies. Views are analyzed separately from public responses.
Company-by-company comparison
Same company, same platform, with month accounted for. Missing estimates mean too few overlapping posts or too little category variation; they do not mean poor performance.
One ranking across companies, based on each post’s response relative to its own company and month.
Ranked by likes, comments and shares relative to the same company’s typical post on the same platform that month. 1× is usual; 5× is five times usual. The score uses +1 to handle zero counts. These are examples, not the statistical test.
Films, metaphors, jokes, memes, and stunts made primarily to attract attention or build familiarity.
Performance relative to each company’s other content
Performance varies across companies.
3 of 5 company estimates are above baseline; 2 are below. The median company estimate is 1.06×. Higher end: MotherDuck 1.81×, Convex 1.20×. Lower end: Parallel 0.82×, Composio 0.96×. The average effect remains uncertain.
1.13×
Estimated combined response vs other content
5 comparable companies · 46 category posts in the model
95% interval: 0.66×–1.95×. The data does not establish a reliable average advantage or disadvantage. The direction across companies and the examples are still informative.
LinkedIn and X separately
No clear material platform difference was established; this does not prove the results are identical.
LinkedIn2.9×95% interval 1.39×–5.9×Estimate: 186% higherDirection or size remains uncertain1 companies
X1.08×95% interval 0.65×–1.82×Estimate: 8% higherDirection or size remains uncertain5 companies
X views: a separate measure of reach0.90×95% interval 0.46×–1.76×Estimate: 10% lowerDirection or size remains uncertain
5 comparable companies. Views are analyzed separately from public responses.
Company-by-company comparison
Same company, same platform, with month accounted for. Missing estimates mean too few overlapping posts or too little category variation; they do not mean poor performance.
One ranking across companies, based on each post’s response relative to its own company and month.
Ranked by likes, comments and shares relative to the same company’s typical post on the same platform that month. 1× is usual; 5× is five times usual. The score uses +1 to handle zero counts. These are examples, not the statistical test.
How companies present the message: interviews, product demos, charts, announcement cards, and other treatments.
Presenter explanation
9 of 11 company estimates are higher. Median company estimate: 1.34×. Range: Braintrust 0.94× to Composio 2.9×. The combined result has stronger statistical support.
Text-led or link post
3 of 20 company estimates are higher. Median company estimate: 0.63×. Range: Firecrawl 0.45× to Trigger.dev 1.29×. The combined result has stronger statistical support.
Platform differences that matter
Product demo or UI: LinkedIn 1.05×, X 1.57× in the same 9 companies. People or event footage: LinkedIn 1.40×, X 0.87× in the same 9 companies.
Read the direction and consistency, not just a significance verdict. Each company is compared with its own other content on the same platform and in overlapping months, then the results are combined across companies. Ranked by estimated relative public response, with uncertainty shown. The company estimates show where the direction repeats or changes. Where platforms differ materially, the row shows separate estimates for the same companies. Open “Uncertainty” for statistical limits; a directional pattern is not a proven winner. Use the direct comparison below to inspect a specific pair.
Higher estimates across most comparable companies.
9 of 11 company estimates are above baseline; 2 are below. The median company estimate is 1.34×. Higher end: Composio 2.9×, Vapi 2.3×. Lower end: Braintrust 0.94×, MotherDuck 0.96×. The combined average also has stronger statistical support.
95% interval: 0.93×–1.97×. The data does not establish a reliable average advantage or disadvantage. The direction across companies and the examples are still informative.
Higher estimates across most comparable companies.
6 of 6 company estimates are above baseline; 0 are below. The median company estimate is 1.28×. Higher end: Composio 4.2×, Braintrust 1.32×. Lower end: turbopuffer 1.17×, LlamaIndex 1.18×. The average effect remains uncertain.
95% interval: 1.18×–1.66×. The estimate has stronger statistical support after accounting for multiple comparisons.
X0.87×Uncertainty
95% interval: 0.66×–1.15×. The data does not establish a reliable average advantage or disadvantage. The direction across companies and the examples are still informative.
Among the same 9 companies, the adjusted estimate is 1.40× on LinkedIn and 0.87× on X, each compared with that account’s other content. The platform difference meets the predefined evidence and size thresholds. The LinkedIn estimate has stronger support.
95% interval: 0.73×–1.89×. The data does not establish a reliable average advantage or disadvantage. The direction across companies and the examples are still informative.
Higher estimates across most comparable companies.
3 of 4 company estimates are above baseline; 1 are below. The median company estimate is 1.20×. Higher end: WorkOS 1.39×, MotherDuck 1.30×. Lower end: Composio 0.86×, Vapi 1.10×. The average effect remains uncertain.
95% interval: 0.87×–1.28×. The data does not establish a reliable average advantage or disadvantage. The direction across companies and the examples are still informative.
X1.57×Uncertainty
95% interval: 1.29×–1.91×. The estimate has stronger statistical support after accounting for multiple comparisons.
Among the same 9 companies, the adjusted estimate is 1.05× on LinkedIn and 1.57× on X, each compared with that account’s other content. The platform difference meets the predefined evidence and size thresholds. The X estimate has stronger support.
95% interval: 0.30×–3.2×. The data does not establish a reliable average advantage or disadvantage. The direction across companies and the examples are still informative.
1 of 3 company estimates are above baseline; 2 are below. The median company estimate is 0.83×. Higher end: Braintrust 2.4×, E2B 0.83×. Lower end: Composio 0.83×, E2B 0.83×. The average effect remains uncertain.
95% interval: 0.77×–1.16×. The data does not establish a reliable average advantage or disadvantage. The direction across companies and the examples are still informative.
6 of 16 company estimates are above baseline; 10 are below. The median company estimate is 0.91×. Higher end: Doppler 3.4×, E2B 1.49×. Lower end: turbopuffer 0.48×, LlamaIndex 0.62×. The average effect remains uncertain.
95% interval: 0.78×–1.14×. The data does not establish a reliable average advantage or disadvantage. The direction across companies and the examples are still informative.
10 of 16 company estimates are above baseline; 6 are below. The median company estimate is 1.06×. Higher end: CrewAI 1.33×, Vapi 1.27×. Lower end: Doppler 0.47×, WorkOS 0.62×. The average effect remains uncertain.
95% interval: 0.48×–1.73×. The data does not establish a reliable average advantage or disadvantage. The direction across companies and the examples are still informative.
1 of 3 company estimates are above baseline; 2 are below. The median company estimate is 0.95×. 2 of 3 are within 10% of baseline. Higher end: MotherDuck 1.03×, turbopuffer 0.95×. Lower end: Browserbase 0.73×, turbopuffer 0.95×. The average effect remains uncertain.
95% interval: 0.69×–1.05×. The data does not establish a reliable average advantage or disadvantage. The direction across companies and the examples are still informative.
1 of 9 company estimates are above baseline; 8 are below. The median company estimate is 0.86×. Higher end: Composio 1.21×, WorkOS 0.93×. Lower end: MotherDuck 0.60×, Fiddler AI 0.66×. The average effect remains uncertain.
3 of 20 company estimates are above baseline; 17 are below. The median company estimate is 0.63×. Higher end: Trigger.dev 1.29×, turbopuffer 1.29×. Lower end: Firecrawl 0.45×, Vapi 0.46×. The combined average also has stronger statistical support.
95% interval: 0.16×–2.7×. The data does not establish a reliable average advantage or disadvantage. The direction across companies and the examples are still informative.
1 of 3 company estimates are above baseline; 2 are below. The median company estimate is 0.75×. Higher end: Convex 1.04×, Braintrust 0.75×. Lower end: Parallel 0.40×, Braintrust 0.75×. The average effect remains uncertain.
95% interval: 0.04×–31.9×. The data does not establish a reliable average advantage or disadvantage. The direction across companies and the examples are still informative.
95% interval: <0.01×–544.8×. The data does not establish a reliable average advantage or disadvantage. The direction across companies and the examples are still informative.
Published by 8 companies, but no company has enough repeated comparable posts for a model estimate.
Individual examples, without a repeatable format average.
The inventory contains 12 posts across 8 companies, but none has five category posts and five other posts in overlapping months. The ranked examples below show actual campaign results relative to their own accounts.
Published by 7 companies, but no company has enough repeated comparable posts for a model estimate.
Individual examples, without a repeatable format average.
The inventory contains 17 posts across 7 companies, but none has five category posts and five other posts in overlapping months. The ranked examples below show actual campaign results relative to their own accounts.
Unknown classifications remain in the inventory, but are excluded from category-effect models. Text-led/link records identify posts without returned root media; an unreturned published link preview may still have been present. Broad conclusions require at least three comparable companies. Directional readouts describe the saved estimates, not statistically proven rules. Formal uncertainty accounts for multiple category comparisons. Each company chip averages its available platform log effects equally; the combined estimate also accounts for precision and between-company variation.
Compare two creative formats
Uses only the same companies, platforms and months where both categories were posted.
A headline, cover image, or link-preview card promoting an article, guide, podcast, or external video.
Performance relative to each company’s other content
Performance varies across companies.
10 of 16 company estimates are above baseline; 6 are below. The median company estimate is 1.06×. Higher end: CrewAI 1.33×, Vapi 1.27×. Lower end: Doppler 0.47×, WorkOS 0.62×. The average effect remains uncertain.
0.95×
Estimated combined response vs other content
16 comparable companies · 713 category posts in the model
95% interval: 0.78×–1.14×. The data does not establish a reliable average advantage or disadvantage. The direction across companies and the examples are still informative.
LinkedIn and X separately
No clear material platform difference was established; this does not prove the results are identical.
LinkedIn0.93×95% interval 0.79×–1.09×Estimate: 7% lowerDirection or size remains uncertain16 companies
X1.05×95% interval 0.88×–1.25×Estimate close to baselineDirection or size remains uncertain12 companies
X views: a separate measure of reach0.86×95% interval 0.69×–1.07×Estimate: 14% lowerDirection or size remains uncertain
12 comparable companies. Views are analyzed separately from public responses.
Company-by-company comparison
Same company, same platform, with month accounted for. Missing estimates mean too few overlapping posts or too little category variation; they do not mean poor performance.
One ranking across companies, based on each post’s response relative to its own company and month.
Ranked by likes, comments and shares relative to the same company’s typical post on the same platform that month. 1× is usual; 5× is five times usual. The score uses +1 to handle zero counts. These are examples, not the statistical test.
A customer speaks about a real implementation, workflow, or result.
Performance relative to each company’s other content
Performance varies across companies.
1 of 3 company estimates are above baseline; 2 are below. The median company estimate is 0.83×. Higher end: Braintrust 2.4×, E2B 0.83×. Lower end: Composio 0.83×, E2B 0.83×. The average effect remains uncertain.
0.99×
Estimated combined response vs other content
3 comparable companies · 36 category posts in the model
95% interval: 0.30×–3.2×. The data does not establish a reliable average advantage or disadvantage. The direction across companies and the examples are still informative.
LinkedIn and X separately
No clear material platform difference was established; this does not prove the results are identical.
LinkedIn1.60×95% interval 0.11×–23.2×Estimate: 60% higherDirection or size remains uncertain3 companies
X0.96×95% interval 0.03×–36.4×Estimate close to baselineDirection or size remains uncertain2 companies
X views: a separate measure of reach0.94×95% interval <0.01×–194.9×Estimate: 6% lowerDirection or size remains uncertain
2 comparable companies. Views are analyzed separately from public responses.
Company-by-company comparison
Same company, same platform, with month accounted for. Missing estimates mean too few overlapping posts or too little category variation; they do not mean poor performance.
One ranking across companies, based on each post’s response relative to its own company and month.
Ranked by likes, comments and shares relative to the same company’s typical post on the same platform that month. 1× is usual; 5× is five times usual. The score uses +1 to handle zero counts. These are examples, not the statistical test.
A conversation with a practitioner or founder, including podcasts and career stories.
Performance relative to each company’s other content
Lower estimates across most comparable companies.
1 of 9 company estimates are above baseline; 8 are below. The median company estimate is 0.86×. Higher end: Composio 1.21×, WorkOS 0.93×. Lower end: MotherDuck 0.60×, Fiddler AI 0.66×. The average effect remains uncertain.
0.85×
Estimated combined response vs other content
9 comparable companies · 161 category posts in the model
95% interval: 0.69×–1.05×. The data does not establish a reliable average advantage or disadvantage. The direction across companies and the examples are still informative.
LinkedIn and X separately
No clear material platform difference was established; this does not prove the results are identical.
LinkedIn0.86×95% interval 0.69×–1.06×Estimate: 14% lowerDirection or size remains uncertain9 companies
X0.86×95% interval 0.72×–1.04×Estimate: 14% lowerDirection or size remains uncertain7 companies
X views: a separate measure of reach0.87×95% interval 0.70×–1.09×Estimate: 13% lowerDirection or size remains uncertain
7 comparable companies. Views are analyzed separately from public responses.
Company-by-company comparison
Same company, same platform, with month accounted for. Missing estimates mean too few overlapping posts or too little category variation; they do not mean poor performance.
One ranking across companies, based on each post’s response relative to its own company and month.
Ranked by likes, comments and shares relative to the same company’s typical post on the same platform that month. 1× is usual; 5× is five times usual. The score uses +1 to handle zero counts. These are examples, not the statistical test.
A person explains an idea, capability, or problem directly to the viewer.
Performance relative to each company’s other content
Higher estimates across most comparable companies.
9 of 11 company estimates are above baseline; 2 are below. The median company estimate is 1.34×. Higher end: Composio 2.9×, Vapi 2.3×. Lower end: Braintrust 0.94×, MotherDuck 0.96×. The combined average also has stronger statistical support.
1.36×
Estimated combined response vs other content
11 comparable companies · 197 category posts in the model
X views: a separate measure of reach1.24×95% interval 0.99×–1.55×Estimate: 24% higherDirection or size remains uncertain
10 comparable companies. Views are analyzed separately from public responses.
Company-by-company comparison
Same company, same platform, with month accounted for. Missing estimates mean too few overlapping posts or too little category variation; they do not mean poor performance.
One ranking across companies, based on each post’s response relative to its own company and month.
Ranked by likes, comments and shares relative to the same company’s typical post on the same platform that month. 1× is usual; 5× is five times usual. The score uses +1 to handle zero counts. These are examples, not the statistical test.
A product interface, screen recording, or walkthrough of a task.
Performance relative to each company’s other content
Stronger on X than LinkedIn in matched companies.
Among the same 9 companies, the adjusted estimate is 1.05× on LinkedIn and 1.57× on X, each compared with that account’s other content. The platform difference meets the predefined evidence and size thresholds. The X estimate has stronger support.
1.15×
Estimated combined response vs other content
14 comparable companies · 313 category posts in the model
95% interval: 0.95×–1.40×. The data does not establish a reliable average advantage or disadvantage. The direction across companies and the examples are still informative.
Platform estimates for the same 9 companies.
LinkedIn1.05×95% interval 0.87×–1.28×Estimate: 5% higherDirection or size remains uncertain
X1.57×95% interval 1.29×–1.91×Estimate: 57% higherStronger statistical support
Both platform estimates use the same companies. Each compares that company’s posts with its own other content and accounts for month.
X views: a separate measure of reach1.23×95% interval 0.92×–1.65×Estimate: 23% higherDirection or size remains uncertain
14 comparable companies. Views are analyzed separately from public responses.
Company-by-company comparison
Same company, same platform, with month accounted for. Missing estimates mean too few overlapping posts or too little category variation; they do not mean poor performance.
One ranking across companies, based on each post’s response relative to its own company and month.
Ranked by likes, comments and shares relative to the same company’s typical post on the same platform that month. 1× is usual; 5× is five times usual. The score uses +1 to handle zero counts. These are examples, not the statistical test.
95% interval: <0.01×–544.8×. The data does not establish a reliable average advantage or disadvantage. The direction across companies and the examples are still informative.
LinkedIn and X separately
No clear material platform difference was established; this does not prove the results are identical.
LinkedIn0.72×95% interval <0.01×–180.9×Estimate: 28% lowerDirection or size remains uncertain2 companies
X1.63×95% interval 0.85×–3.1×Estimate: 63% higherDirection or size remains uncertain1 companies
X views: a separate measure of reach1.61×95% interval 0.72×–3.6×Estimate: 61% higherDirection or size remains uncertain
1 comparable companies. Views are analyzed separately from public responses.
Company-by-company comparison
Same company, same platform, with month accounted for. Missing estimates mean too few overlapping posts or too little category variation; they do not mean poor performance.
One ranking across companies, based on each post’s response relative to its own company and month.
Ranked by likes, comments and shares relative to the same company’s typical post on the same platform that month. 1× is usual; 5× is five times usual. The score uses +1 to handle zero counts. These are examples, not the statistical test.
A visual comparison, benchmark, measurement, or before-and-after result.
Performance relative to each company’s other content
Higher estimates across most comparable companies.
6 of 6 company estimates are above baseline; 0 are below. The median company estimate is 1.28×. Higher end: Composio 4.2×, Braintrust 1.32×. Lower end: turbopuffer 1.17×, LlamaIndex 1.18×. The average effect remains uncertain.
1.35×
Estimated combined response vs other content
6 comparable companies · 157 category posts in the model
95% interval: 0.93×–1.97×. The data does not establish a reliable average advantage or disadvantage. The direction across companies and the examples are still informative.
LinkedIn and X separately
No clear material platform difference was established; this does not prove the results are identical.
LinkedIn1.07×95% interval 0.71×–1.61×Estimate: 7% higherDirection or size remains uncertain4 companies
X1.53×95% interval 0.98×–2.4×Estimate: 53% higherDirection or size remains uncertain6 companies
X views: a separate measure of reach1.45×95% interval 0.85×–2.5×Estimate: 45% higherDirection or size remains uncertain
6 comparable companies. Views are analyzed separately from public responses.
Company-by-company comparison
Same company, same platform, with month accounted for. Missing estimates mean too few overlapping posts or too little category variation; they do not mean poor performance.
One ranking across companies, based on each post’s response relative to its own company and month.
Ranked by likes, comments and shares relative to the same company’s typical post on the same platform that month. 1× is usual; 5× is five times usual. The score uses +1 to handle zero counts. These are examples, not the statistical test.
Code, terminal output, or a diagram explaining how a system works.
Performance relative to each company’s other content
Often close to the account’s usual response.
1 of 3 company estimates are above baseline; 2 are below. The median company estimate is 0.95×. 2 of 3 are within 10% of baseline. Higher end: MotherDuck 1.03×, turbopuffer 0.95×. Lower end: Browserbase 0.73×, turbopuffer 0.95×. The average effect remains uncertain.
0.91×
Estimated combined response vs other content
3 comparable companies · 41 category posts in the model
95% interval: 0.48×–1.73×. The data does not establish a reliable average advantage or disadvantage. The direction across companies and the examples are still informative.
LinkedIn and X separately
No clear material platform difference was established; this does not prove the results are identical.
LinkedIn0.81×95% interval 0.41×–1.61×Estimate: 19% lowerDirection or size remains uncertain3 companies
X0.93×95% interval 0.10×–8.3×Estimate: 7% lowerDirection or size remains uncertain2 companies
X views: a separate measure of reach1.07×95% interval 0.04×–31.6×Estimate: 7% higherDirection or size remains uncertain
2 comparable companies. Views are analyzed separately from public responses.
Company-by-company comparison
Same company, same platform, with month accounted for. Missing estimates mean too few overlapping posts or too little category variation; they do not mean poor performance.
One ranking across companies, based on each post’s response relative to its own company and month.
Ranked by likes, comments and shares relative to the same company’s typical post on the same platform that month. 1× is usual; 5× is five times usual. The score uses +1 to handle zero counts. These are examples, not the statistical test.
A product, partner, employee, milestone, or event announcement, static or animated.
Performance relative to each company’s other content
Performance varies across companies.
6 of 16 company estimates are above baseline; 10 are below. The median company estimate is 0.91×. Higher end: Doppler 3.4×, E2B 1.49×. Lower end: turbopuffer 0.48×, LlamaIndex 0.62×. The average effect remains uncertain.
0.95×
Estimated combined response vs other content
16 comparable companies · 681 category posts in the model
95% interval: 0.77×–1.16×. The data does not establish a reliable average advantage or disadvantage. The direction across companies and the examples are still informative.
LinkedIn and X separately
No clear material platform difference was established; this does not prove the results are identical.
LinkedIn0.98×95% interval 0.79×–1.22×Estimate close to baselineDirection or size remains uncertain15 companies
X views: a separate measure of reach0.84×95% interval 0.69×–1.04×Estimate: 16% lowerDirection or size remains uncertain
14 comparable companies. Views are analyzed separately from public responses.
Company-by-company comparison
Same company, same platform, with month accounted for. Missing estimates mean too few overlapping posts or too little category variation; they do not mean poor performance.
One ranking across companies, based on each post’s response relative to its own company and month.
Ranked by likes, comments and shares relative to the same company’s typical post on the same platform that month. 1× is usual; 5× is five times usual. The score uses +1 to handle zero counts. These are examples, not the statistical test.
A customer quote or result packaged as a still graphic.
Performance relative to each company’s other content
Performance varies across companies.
1 of 3 company estimates are above baseline; 2 are below. The median company estimate is 0.75×. Higher end: Convex 1.04×, Braintrust 0.75×. Lower end: Parallel 0.40×, Braintrust 0.75×. The average effect remains uncertain.
0.66×
Estimated combined response vs other content
3 comparable companies · 27 category posts in the model
95% interval: 0.16×–2.7×. The data does not establish a reliable average advantage or disadvantage. The direction across companies and the examples are still informative.
LinkedIn and X separately
No clear material platform difference was established; this does not prove the results are identical.
LinkedIn1.00×95% interval 0.11×–9.4×Estimate close to baselineDirection or size remains uncertain2 companies
X0.44×95% interval 0.06×–3.2×Estimate: 56% lowerDirection or size remains uncertain2 companies
X views: a separate measure of reach0.48×95% interval 0.03×–8.1×Estimate: 52% lowerDirection or size remains uncertain
2 comparable companies. Views are analyzed separately from public responses.
Company-by-company comparison
Same company, same platform, with month accounted for. Missing estimates mean too few overlapping posts or too little category variation; they do not mean poor performance.
One ranking across companies, based on each post’s response relative to its own company and month.
Ranked by likes, comments and shares relative to the same company’s typical post on the same platform that month. 1× is usual; 5× is five times usual. The score uses +1 to handle zero counts. These are examples, not the statistical test.
95% interval: 0.04×–31.9×. The data does not establish a reliable average advantage or disadvantage. The direction across companies and the examples are still informative.
LinkedIn and X separately
No clear material platform difference was established; this does not prove the results are identical.
LinkedIn1.24×95% interval 0.05×–29.4×Estimate: 24% higherDirection or size remains uncertain2 companies
X1.03×95% interval 0.57×–1.83×Estimate close to baselineDirection or size remains uncertain1 companies
X views: a separate measure of reach1.59×95% interval 0.49×–5.2×Estimate: 59% higherDirection or size remains uncertain
1 comparable companies. Views are analyzed separately from public responses.
Company-by-company comparison
Same company, same platform, with month accounted for. Missing estimates mean too few overlapping posts or too little category variation; they do not mean poor performance.
One ranking across companies, based on each post’s response relative to its own company and month.
Ranked by likes, comments and shares relative to the same company’s typical post on the same platform that month. 1× is usual; 5× is five times usual. The score uses +1 to handle zero counts. These are examples, not the statistical test.
Photography or footage of teams, booths, gatherings, and company life.
Performance relative to each company’s other content
Stronger on LinkedIn than X in matched companies.
Among the same 9 companies, the adjusted estimate is 1.40× on LinkedIn and 0.87× on X, each compared with that account’s other content. The platform difference meets the predefined evidence and size thresholds. The LinkedIn estimate has stronger support.
1.21×
Estimated combined response vs other content
13 comparable companies · 310 category posts in the model
95% interval: 0.97×–1.51×. The data does not establish a reliable average advantage or disadvantage. The direction across companies and the examples are still informative.
Platform estimates for the same 9 companies.
LinkedIn1.40×95% interval 1.18×–1.66×Estimate: 40% higherStronger statistical support
X0.87×95% interval 0.66×–1.15×Estimate: 13% lowerDirection or size remains uncertain
Both platform estimates use the same companies. Each compares that company’s posts with its own other content and accounts for month.
X views: a separate measure of reach0.71×95% interval 0.51×–0.99×Estimate: 29% lowerDirection or size remains uncertain
9 comparable companies. Views are analyzed separately from public responses.
Company-by-company comparison
Same company, same platform, with month accounted for. Missing estimates mean too few overlapping posts or too little category variation; they do not mean poor performance.
One ranking across companies, based on each post’s response relative to its own company and month.
Ranked by likes, comments and shares relative to the same company’s typical post on the same platform that month. 1× is usual; 5× is five times usual. The score uses +1 to handle zero counts. These are examples, not the statistical test.
Animation that explains a capability or concept beyond a single announcement card.
Performance relative to each company’s other content
Individual examples, without a repeatable format average.
The inventory contains 12 posts across 8 companies, but none has five category posts and five other posts in overlapping months. The ranked examples below show actual campaign results relative to their own accounts.
Not enough comparable posts
Estimated combined response vs other content
0 comparable companies · 0 category posts in the model
Published by 8 companies, but no company has enough repeated comparable posts for a model estimate.LinkedIn and X separately
No clear material platform difference was established; this does not prove the results are identical.
LinkedInNot enough comparable postsNo format average computed; use the ranked examples below.0 companies
XNot enough comparable postsNo format average computed; use the ranked examples below.0 companies
X views: a separate measure of reachNot enough comparable postsNo format average computed; use the ranked examples below.
0 comparable companies. Views are analyzed separately from public responses.
Company-by-company comparison
Same company, same platform, with month accounted for. Missing estimates mean too few overlapping posts or too little category variation; they do not mean poor performance.
One ranking across companies, based on each post’s response relative to its own company and month.
Ranked by likes, comments and shares relative to the same company’s typical post on the same platform that month. 1× is usual; 5× is five times usual. The score uses +1 to handle zero counts. These are examples, not the statistical test.
A document or carousel presented as a sequence of explanatory slides.
Performance relative to each company’s other content
Individual examples, without a repeatable format average.
The inventory contains 17 posts across 7 companies, but none has five category posts and five other posts in overlapping months. The ranked examples below show actual campaign results relative to their own accounts.
Not enough comparable posts
Estimated combined response vs other content
0 comparable companies · 0 category posts in the model
Published by 7 companies, but no company has enough repeated comparable posts for a model estimate.LinkedIn and X separately
No clear material platform difference was established; this does not prove the results are identical.
LinkedInNot enough comparable postsNo format average computed; use the ranked examples below.0 companies
XNot enough comparable postsNo format average computed; use the ranked examples below.0 companies
X views: a separate measure of reachNot enough comparable postsNo format average computed; use the ranked examples below.
0 comparable companies. Views are analyzed separately from public responses.
Company-by-company comparison
Same company, same platform, with month accounted for. Missing estimates mean too few overlapping posts or too little category variation; they do not mean poor performance.
One ranking across companies, based on each post’s response relative to its own company and month.
Ranked by likes, comments and shares relative to the same company’s typical post on the same platform that month. 1× is usual; 5× is five times usual. The score uses +1 to handle zero counts. These are examples, not the statistical test.
The returned post record is led by writing or a link, without root image/video media.
Performance relative to each company’s other content
Lower estimates across most comparable companies.
3 of 20 company estimates are above baseline; 17 are below. The median company estimate is 0.63×. Higher end: Trigger.dev 1.29×, turbopuffer 1.29×. Lower end: Firecrawl 0.45×, Vapi 0.46×. The combined average also has stronger statistical support.
0.66×
Estimated combined response vs other content
20 comparable companies · 735 category posts in the model
X views: a separate measure of reach0.81×95% interval 0.69×–0.96×Estimate: 19% lowerDirection or size remains uncertain
19 comparable companies. Views are analyzed separately from public responses.
Company-by-company comparison
Same company, same platform, with month accounted for. Missing estimates mean too few overlapping posts or too little category variation; they do not mean poor performance.
One ranking across companies, based on each post’s response relative to its own company and month.
Ranked by likes, comments and shares relative to the same company’s typical post on the same platform that month. 1× is usual; 5× is five times usual. The score uses +1 to handle zero counts. These are examples, not the statistical test.
An illustrated explanation, character graphic, meme, or visual joke.
Performance relative to each company’s other content
Higher estimates across most comparable companies.
3 of 4 company estimates are above baseline; 1 are below. The median company estimate is 1.20×. Higher end: WorkOS 1.39×, MotherDuck 1.30×. Lower end: Composio 0.86×, Vapi 1.10×. The average effect remains uncertain.
1.17×
Estimated combined response vs other content
4 comparable companies · 48 category posts in the model
95% interval: 0.73×–1.89×. The data does not establish a reliable average advantage or disadvantage. The direction across companies and the examples are still informative.
LinkedIn and X separately
No clear material platform difference was established; this does not prove the results are identical.
LinkedIn1.36×95% interval 0.09×–19.6×Estimate: 36% higherDirection or size remains uncertain2 companies
X1.12×95% interval 0.49×–2.5×Estimate: 12% higherDirection or size remains uncertain3 companies
X views: a separate measure of reach0.80×95% interval 0.45×–1.45×Estimate: 20% lowerDirection or size remains uncertain
3 comparable companies. Views are analyzed separately from public responses.
Company-by-company comparison
Same company, same platform, with month accounted for. Missing estimates mean too few overlapping posts or too little category variation; they do not mean poor performance.
One ranking across companies, based on each post’s response relative to its own company and month.
Ranked by likes, comments and shares relative to the same company’s typical post on the same platform that month. 1× is usual; 5× is five times usual. The score uses +1 to handle zero counts. These are examples, not the statistical test.